

Bitcoin has already jumped more than 25% since its recent low, rising from the US$64,000 range in mid-August to around US$80,000. The recovery has reignited the question among investors: is the move just a bounce after a sharp drop, or the beginning of a new bull cycle?
For Pedro Fontes, research analyst at Mercado Bitcoin, two charts help explain why the market has started to regain strength: sellers are exhausted, and the price has recovered relative to important investor cost averages. The view is that Bitcoin has left behind a phase of intense pressure, but still needs to confirm demand to sustain the turnaround.#LululemonTumbles20%OnWeakGuidance
According to him, BTC started August falling, breaking through relevant supports and even dipping below important average price regions. This type of move often indicates that some recent investors ended up at a loss and started selling to reduce losses. The turning point came when the market began to absorb that selling pressure again and resumed technical levels tracked by short-term traders and investors.
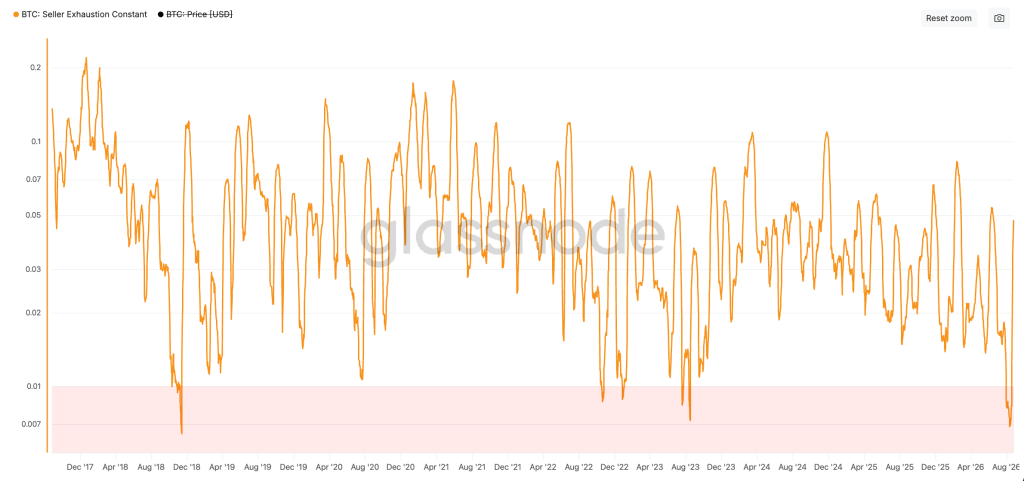
This chart shows exactly that the market went through a phase of capitulation or seller exhaustion, in which the supply from those who wanted to exit began to lose momentum. In practice, that helps explain why Bitcoin found support after the drop and managed to rebound strongly.
In addition to the technical read, Fontes points out that the rally was also helped by macroeconomic factors. One of the main triggers came from the United States, after Treasury Secretary Scott Bessent announced that the government would double the volume of repurchases of long-term bonds, from $2 billion to $4 billion per operation, starting September 9.#USAugustAvgHourlyEarningsRise3.1%
The market interpreted the move as an attempt to ease long-term interest rates and reduce the refinancing cost of U.S. debt. As a result, bond yields eased, the dollar lost strength, and assets like Bitcoin and Ethereum reacted. According to the MB analyst, in the same period in which Bitcoin rose about 25%, Ethereum gained more than 40%, Hyperliquid jumped 44%, and Solana climbed nearly 38%.
Another point cited by Fontes is that Bitcoin held up even against news that, at other times, could have triggered risk aversion. He mentions the United States’ attacks on nuclear facilities in Iran and notes that, despite the geopolitical shock, the market understood the episode as localized, with no immediate escalation in oil or other global fronts.
Price broke back above an important moving average
The second chart highlighted by Fontes shows Bitcoin’s price behavior relative to an average cost region tracked by the market. According to him, when BTC trades back above that average, part of the investors who were sitting at a loss return to profit, which can reduce selling pressure and create a base for a resumption.
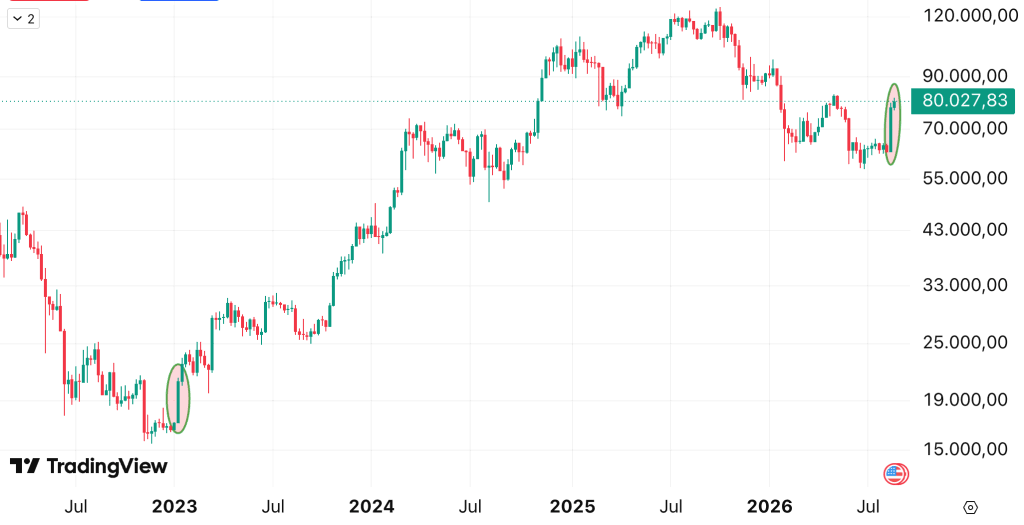
This chart proves how the price stopped merely reacting and began breaking through a zone that, in the past, has already marked relevant trend changes. In light of this, Fontes compares the current dynamic with moves seen in 2023, when Bitcoin also crossed key moving averages before sustaining a bullish phase.#BitcoinEthereumHitMultiMonthHighs
Even so, the MB analyst avoids treating the rally as a definitive turnaround. According to him, a more consistent reversal will depend on Bitcoin’s ability to attract and maintain demand going forward. Among the signals that would confirm the positive outlook are keeping BTC above the $70,000 to $71,000 region, continued inflows into ETFs, and new measures from the U.S. Treasury that reinforce the decline in long-term yields.
ETFs appear as an important piece of this equation. After months of weaker interest, the funds started recording significant inflows again toward the end of August. For the analyst, the continuation of this flow would help show that the rally was not just a technical move or a short squeeze, but also a renewed institutional demand.
On the other hand, the outlook would be weakened if ETFs start recording outflows again and if Bitcoin loses the $70,000 to $71,000 region without a quick recovery. In that scenario, the recent rally could be interpreted as only a rebound within an still-unclear trend, rather than the start of a new bull cycle.$BTC
Fontes’ conclusion is that Bitcoin shows more constructive technical signals than a few weeks ago, but it still needs to confirm strength. For conservative investors, the recommendation is to wait for confirmation before increasing exposure. For moderate and aggressive profiles, the view is that the window is starting to improve, as long as the position size respects market volatility.