
Oliver Kell is an American trend trader. He once won the U.S. Investing Championship stock group with a return of 941.1%, nearly twice that of the second-place finisher.
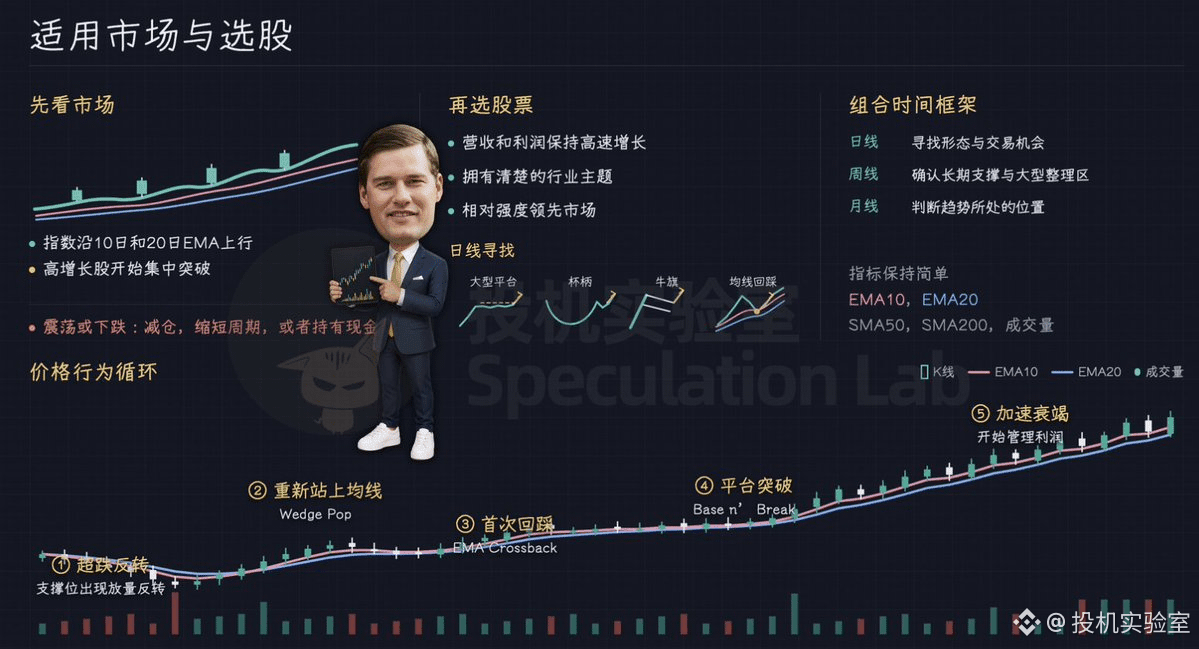
His most classic method is called Cycle of Price Action. This method first determines where a stock is within a trend, enters when an uptrend has just formed, adds to positions after the trend is confirmed, and exits when the move becomes overheated or falls back to key moving averages.
This method is suited to strong markets with clear trends, especially stages when high-growth stocks break out across the board and the broader market rises along short-term moving averages.
When the market turns choppy or declines, Kell reduces position sizes, shortens holding periods, or temporarily holds cash. When selecting stocks, he focuses on companies with rapid revenue and profit growth, clear industry themes, and relative strength that leads the market.
He then looks for opportunities on the daily chart such as large bases, cup and handle patterns, bull flags, and moving average pullbacks, while the weekly and monthly charts are used to confirm long-term support and trend position.
$BTC
His most classic method is called Cycle of Price Action. This method first determines where a stock is within a trend, enters when an uptrend has just formed, adds to positions after the trend is confirmed, and exits when the move becomes overheated or falls back to key moving averages.
This method is suited to strong markets with clear trends, especially stages when high-growth stocks break out across the board and the broader market rises along short-term moving averages.
When the market turns choppy or declines, Kell reduces position sizes, shortens holding periods, or temporarily holds cash. When selecting stocks, he focuses on companies with rapid revenue and profit growth, clear industry themes, and relative strength that leads the market.
He then looks for opportunities on the daily chart such as large bases, cup and handle patterns, bull flags, and moving average pullbacks, while the weekly and monthly charts are used to confirm long-term support and trend position.
$BTC