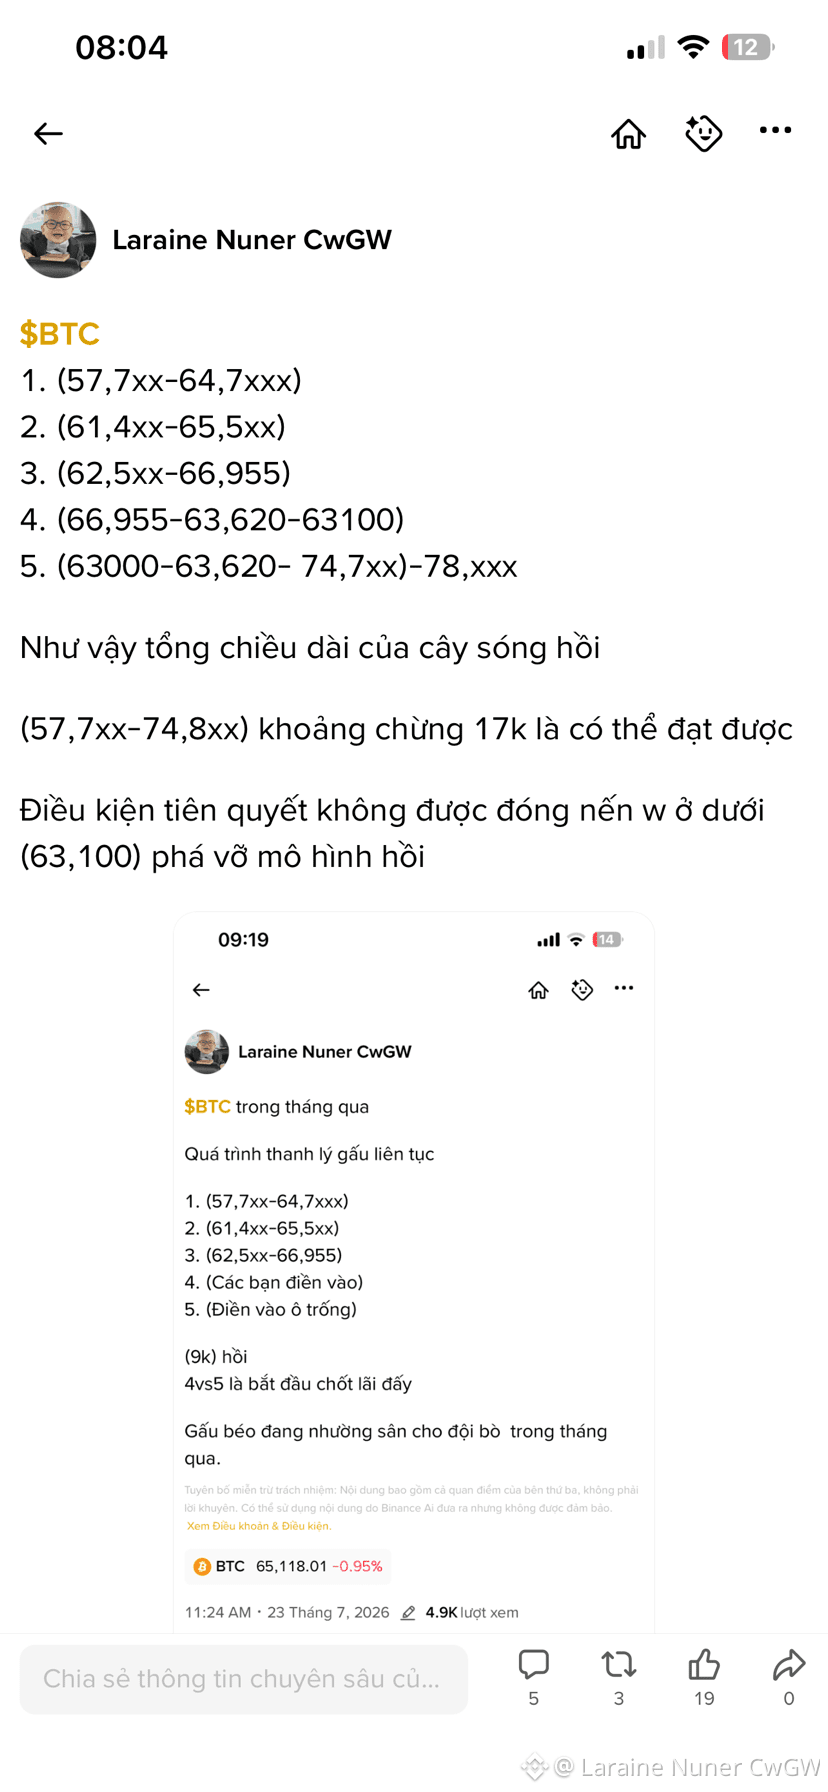
$BTC I am observing BTC’s price waves
- According to my own technical analysis,
BTC has successfully completed a 5-wave corrective rebound starting from
57,7xx and ending at 79,7xx
- and at the 79,7xx area, it did not reverse downward, but continued breaking resistance and moved up to test MA50 successfully at 82,2xx
Reaching a length of nearly 24.5k in the rebound suggests institutional participation, and this is also a common area for profit-taking.
So we need to keep observing the longer-term view.
- For example: this is the wave of a larger uptrend timeframe
Then the previous 5 smaller corrective waves from (57,7xx-79,7xx) are only the first 3 smaller waves of the larger timeframe, with a length of 22k-22.5k
And we are currently in wave 4: the corrective wave.
And after the correction, wave 5 of the larger timeframe will follow.
So the bottom of wave 4 is: 76,261
The top of wave 4 is: 82,285
(76,261+82,285)/2=79,273
And wave 5 will start from here if the correction is complete
The length of wave 5 in the larger timeframe may be about half the length of wave 3, around 12k-14k, not counting wicks.
79,273+12,000=91,273
79,274+14,000=93,273
Thus, weekly BTC candles (w) closing above 79,273 are bullish. And if price moves far away from this area, it can be considered a signal; there have already been 3 near-MA50 tests, but all were rejected at 81,500-82,285-81,5xx
So we need to keep watching and cannot conclude yet.
But above 79,300-80,300 supports the upward trend; otherwise, it continues to correct
- According to my own technical analysis,
BTC has successfully completed a 5-wave corrective rebound starting from
57,7xx and ending at 79,7xx
- and at the 79,7xx area, it did not reverse downward, but continued breaking resistance and moved up to test MA50 successfully at 82,2xx
Reaching a length of nearly 24.5k in the rebound suggests institutional participation, and this is also a common area for profit-taking.
So we need to keep observing the longer-term view.
- For example: this is the wave of a larger uptrend timeframe
Then the previous 5 smaller corrective waves from (57,7xx-79,7xx) are only the first 3 smaller waves of the larger timeframe, with a length of 22k-22.5k
And we are currently in wave 4: the corrective wave.
And after the correction, wave 5 of the larger timeframe will follow.
So the bottom of wave 4 is: 76,261
The top of wave 4 is: 82,285
(76,261+82,285)/2=79,273
And wave 5 will start from here if the correction is complete
The length of wave 5 in the larger timeframe may be about half the length of wave 3, around 12k-14k, not counting wicks.
79,273+12,000=91,273
79,274+14,000=93,273
Thus, weekly BTC candles (w) closing above 79,273 are bullish. And if price moves far away from this area, it can be considered a signal; there have already been 3 near-MA50 tests, but all were rejected at 81,500-82,285-81,5xx
So we need to keep watching and cannot conclude yet.
But above 79,300-80,300 supports the upward trend; otherwise, it continues to correct