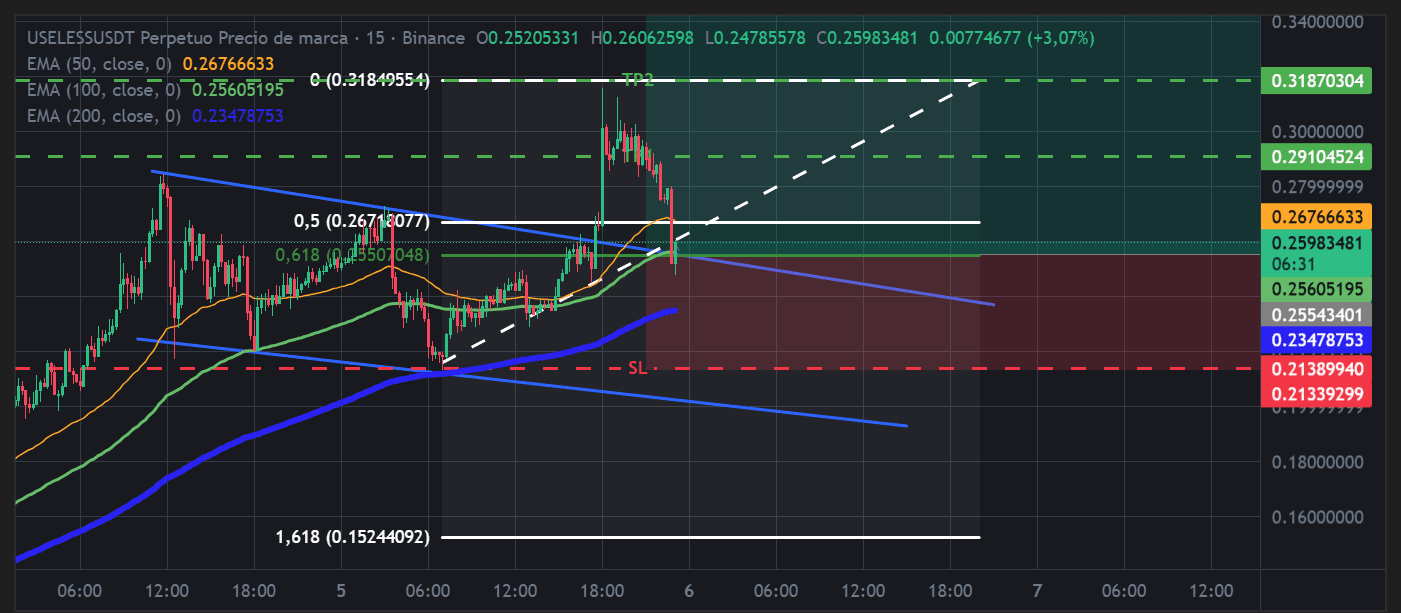
When the noise from the smaller timeframes makes you dizzy, the best decision you can make as a trader is to zoom out and look at the whole picture. The 1H chart of $USELESS is showing us exactly who is in control.
$USELESS - 🟢 LONG - Conf 90%
Trading Plan:
Entry: 0.25500000 – 0.26300000
SL: 0.21389940
TP1: 0.29104524
TP2: 0.32500000 (Extension)
The macro reading of the trade:
Trend is your friend: If we look at the 1-hour timeframe, the structure is like clockwork. The asset has been marking a perfect sequence of higher lows and higher highs (Higher Highs & Higher Lows). Trading against this locomotive is financial suicide; we look to jump on at the technical pullbacks.
Defense of the bigger moving average: The latest bearish shakeout scared many on 5- or 15-minute timeframes, but on 1H we see that price simply came to unload indicators and seek liquidity near the 50-period EMA (orange line). That zone acted as an institutional trampoline.
Clearing leveraged traders: This healthy correction helped sweep out late buyers who entered overleveraged at the top. With the market now lighter, the probability of retesting the 0.2910 zone (our TP1) increases dramatically.
Room to breathe: When trading a 1H structure, moves are wider. That is why our Stop Loss is strategically placed at 0.2138, giving price the necessary room to breathe without normal volatility taking us out of the market too early.
Let's be honest: are you one of those who get scared and sell when you see a strong red candle on 5 minutes, or do you have the patience and cool-headedness to ride solid trends by watching the 1 Hour chart?
Tell me your style in the comments!
Click here to trade 👇
$USELESS - 🟢 LONG - Conf 90%
Trading Plan:
Entry: 0.25500000 – 0.26300000
SL: 0.21389940
TP1: 0.29104524
TP2: 0.32500000 (Extension)
The macro reading of the trade:
Trend is your friend: If we look at the 1-hour timeframe, the structure is like clockwork. The asset has been marking a perfect sequence of higher lows and higher highs (Higher Highs & Higher Lows). Trading against this locomotive is financial suicide; we look to jump on at the technical pullbacks.
Defense of the bigger moving average: The latest bearish shakeout scared many on 5- or 15-minute timeframes, but on 1H we see that price simply came to unload indicators and seek liquidity near the 50-period EMA (orange line). That zone acted as an institutional trampoline.
Clearing leveraged traders: This healthy correction helped sweep out late buyers who entered overleveraged at the top. With the market now lighter, the probability of retesting the 0.2910 zone (our TP1) increases dramatically.
Room to breathe: When trading a 1H structure, moves are wider. That is why our Stop Loss is strategically placed at 0.2138, giving price the necessary room to breathe without normal volatility taking us out of the market too early.
Let's be honest: are you one of those who get scared and sell when you see a strong red candle on 5 minutes, or do you have the patience and cool-headedness to ride solid trends by watching the 1 Hour chart?
Tell me your style in the comments!
Click here to trade 👇