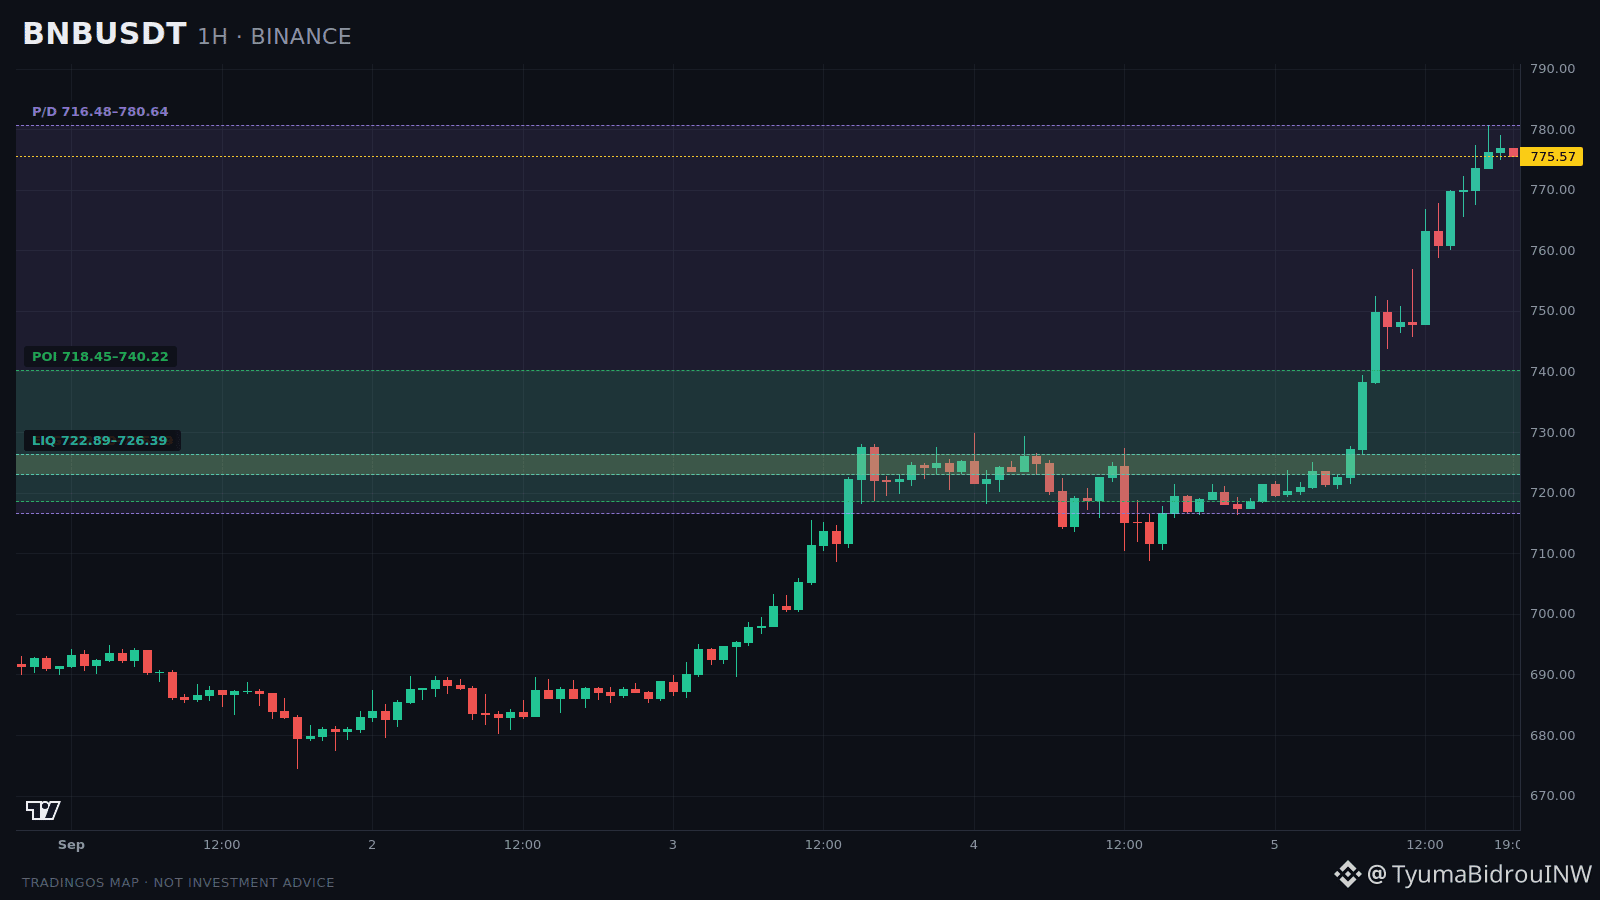
Markup for $BNB is simple: the area below the current price; the rest will be shown by the reaction.
Price is around 775.93, up +7.894% over the day.
Daily range: 716.48-780.64.
What TradingOS shows:
— below the current price is POI 719.49-740.8925 — reaction zone below price;
— below the current price is bullish FVG 727.71-738.16 — reaction zone below price;
— below the current price is bullish FVG 722.89-726.39 — reaction zone below price;
— below the current price is bearish OB zone 721.86-725.05 — reaction zone below price;
Scenario weights based on current data:
long scenario — 73%;
short scenario — 9%.
This is not the probability of a trade, but an assessment of the context.
What matters:
you should look not at the forecast, but at the price reaction near the nearest working TradingOS zone.
This is a scenario map, not trading instructions.
$BNB #Crypto #BinanceSquare #Trading
Chart and order book — click on $BNB .
Not investment advice.
Is this format useful? Let me know in the comments what to add.
Real-time breakdowns and the full journal — on X: @TyumaBidrouINW
Price is around 775.93, up +7.894% over the day.
Daily range: 716.48-780.64.
What TradingOS shows:
— below the current price is POI 719.49-740.8925 — reaction zone below price;
— below the current price is bullish FVG 727.71-738.16 — reaction zone below price;
— below the current price is bullish FVG 722.89-726.39 — reaction zone below price;
— below the current price is bearish OB zone 721.86-725.05 — reaction zone below price;
Scenario weights based on current data:
long scenario — 73%;
short scenario — 9%.
This is not the probability of a trade, but an assessment of the context.
What matters:
you should look not at the forecast, but at the price reaction near the nearest working TradingOS zone.
This is a scenario map, not trading instructions.
$BNB #Crypto #BinanceSquare #Trading
Chart and order book — click on $BNB .
Not investment advice.
Is this format useful? Let me know in the comments what to add.
Real-time breakdowns and the full journal — on X: @TyumaBidrouINW