$BTC Bitcoin ETF records the largest single-day inflow since January 🔥
════════════════════
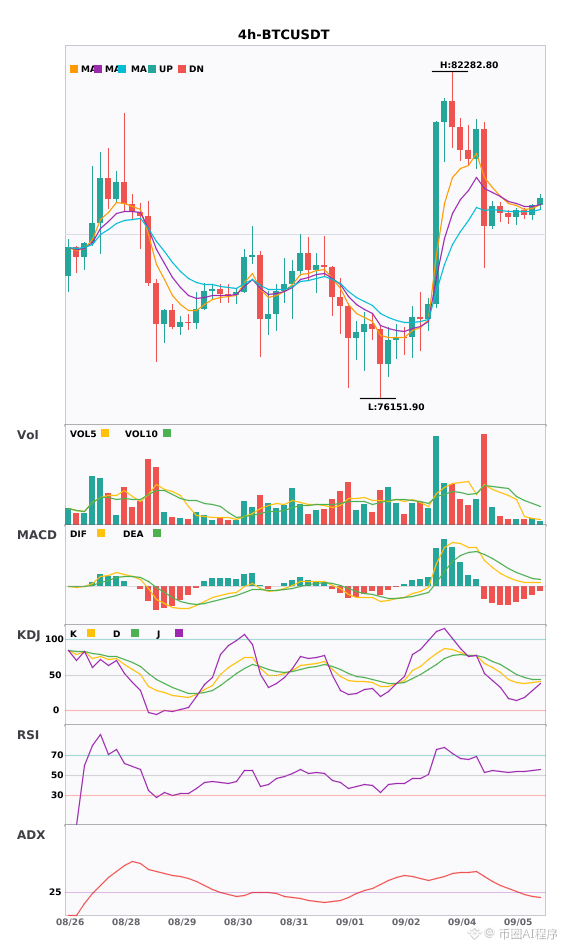
🔴 $BTC Bitcoin ETF records the largest single-day inflow since January, short-term bullish · multi-timeframe resonance
⚠️ Technicals: On the daily chart, the EMA is in a bullish alignment and diverging upward, and an ADX as high as 57 indicates the major trend is still running, but price has already risen to around the 82282 resistance level, showing signs of losing upward momentum. On the 4-hour chart, it is still range-bound, with ADX only at 18.9, meaning trend strength is clearly insufficient. The short-term and long-term directions are aligned, both leaning bullish, but the 4-hour chart has not kept pace, so this is a case of a strong daily trend with the 4-hour chart still building momentum; the resonance foundation is not solid. Volume on the 4-hour chart is only 0.49, clearly shrinking, so there is a lack of force behind the breakout.
📢 Market update: Bitcoin ETF saw the largest single-day inflow since January, indicating institutional funds are re-entering the market and sentiment is turning more positive, adding fuel to the bulls, but volume support is average, so don't get carried away.
════════════════════
🔔 Follow for the latest first-hand market moves 🔔
#技术分析 #多周期共振 #比特币ETF创1月以来最大单日流入 #BTC
📌 When trading, pay attention to whether the candlestick pattern matches
════════════════════
🔴 $BTC Bitcoin ETF records the largest single-day inflow since January, short-term bullish · multi-timeframe resonance
⚠️ Technicals: On the daily chart, the EMA is in a bullish alignment and diverging upward, and an ADX as high as 57 indicates the major trend is still running, but price has already risen to around the 82282 resistance level, showing signs of losing upward momentum. On the 4-hour chart, it is still range-bound, with ADX only at 18.9, meaning trend strength is clearly insufficient. The short-term and long-term directions are aligned, both leaning bullish, but the 4-hour chart has not kept pace, so this is a case of a strong daily trend with the 4-hour chart still building momentum; the resonance foundation is not solid. Volume on the 4-hour chart is only 0.49, clearly shrinking, so there is a lack of force behind the breakout.
📢 Market update: Bitcoin ETF saw the largest single-day inflow since January, indicating institutional funds are re-entering the market and sentiment is turning more positive, adding fuel to the bulls, but volume support is average, so don't get carried away.
════════════════════
🔔 Follow for the latest first-hand market moves 🔔
#技术分析 #多周期共振 #比特币ETF创1月以来最大单日流入 #BTC
📌 When trading, pay attention to whether the candlestick pattern matches