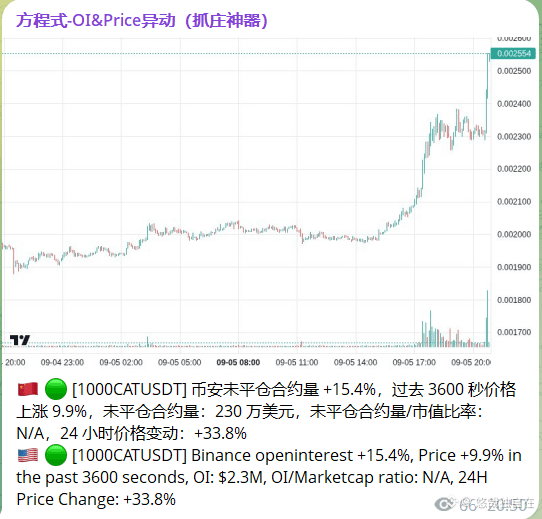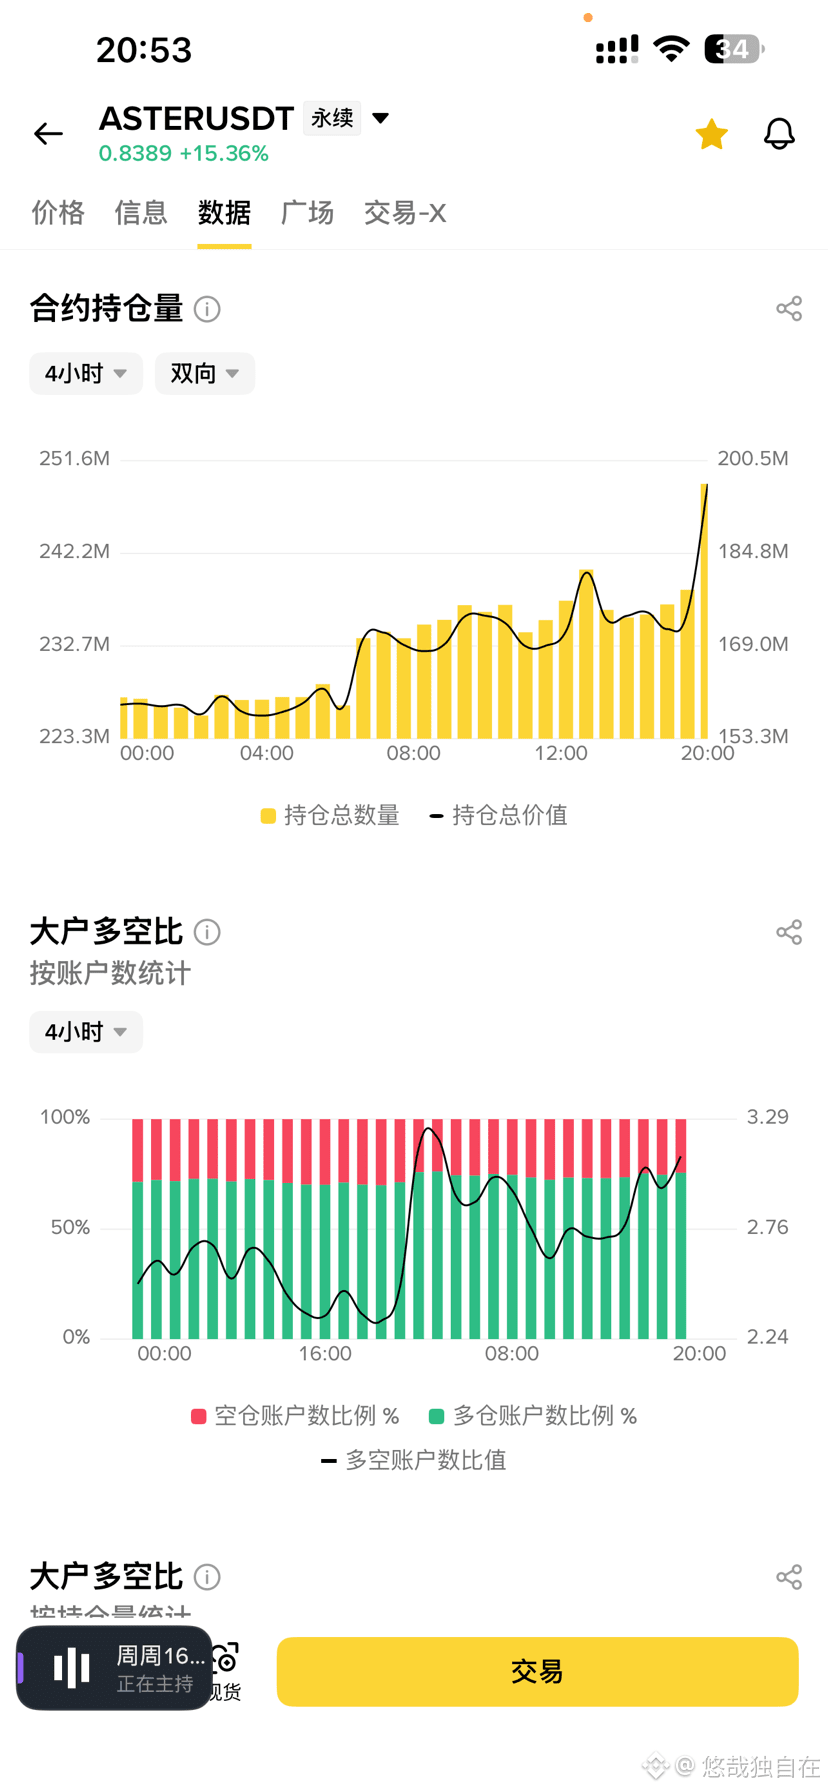
Just received a data push, and this $ASTER chart is kind of interesting
In 15 minutes, price surged 7.5%, and open interest rose 5.0% in sync. OI is now at $109.1 million. Price up, positions up — that means real money is entering, not just a sentiment-driven pump. Also, the OI/market cap ratio has reached 5.0%, which shows the amount of capital in derivatives is already quite large
But looking back at the candlestick chart, from 0.72 up to 0.84, RSI on the 1-hour timeframe hit 97, severely overbought. In a structure like this, chasing it now could be dangerous. Once the main players start taking profits, the pullback could be sharp. However, open interest is still rising, which means new longs are still coming in, so the move isn’t over yet
My operational view is: I wouldn’t chase at this level, but I’d watch the key 0.80 level closely. If it pulls back near 0.80 and stabilizes, with volume not shrinking, I’d consider taking a small position. Set the stop loss at 0.77, and the first target around 0.88
#ASTER $ASTER
In 15 minutes, price surged 7.5%, and open interest rose 5.0% in sync. OI is now at $109.1 million. Price up, positions up — that means real money is entering, not just a sentiment-driven pump. Also, the OI/market cap ratio has reached 5.0%, which shows the amount of capital in derivatives is already quite large
But looking back at the candlestick chart, from 0.72 up to 0.84, RSI on the 1-hour timeframe hit 97, severely overbought. In a structure like this, chasing it now could be dangerous. Once the main players start taking profits, the pullback could be sharp. However, open interest is still rising, which means new longs are still coming in, so the move isn’t over yet
My operational view is: I wouldn’t chase at this level, but I’d watch the key 0.80 level closely. If it pulls back near 0.80 and stabilizes, with volume not shrinking, I’d consider taking a small position. Set the stop loss at 0.77, and the first target around 0.88
#ASTER $ASTER