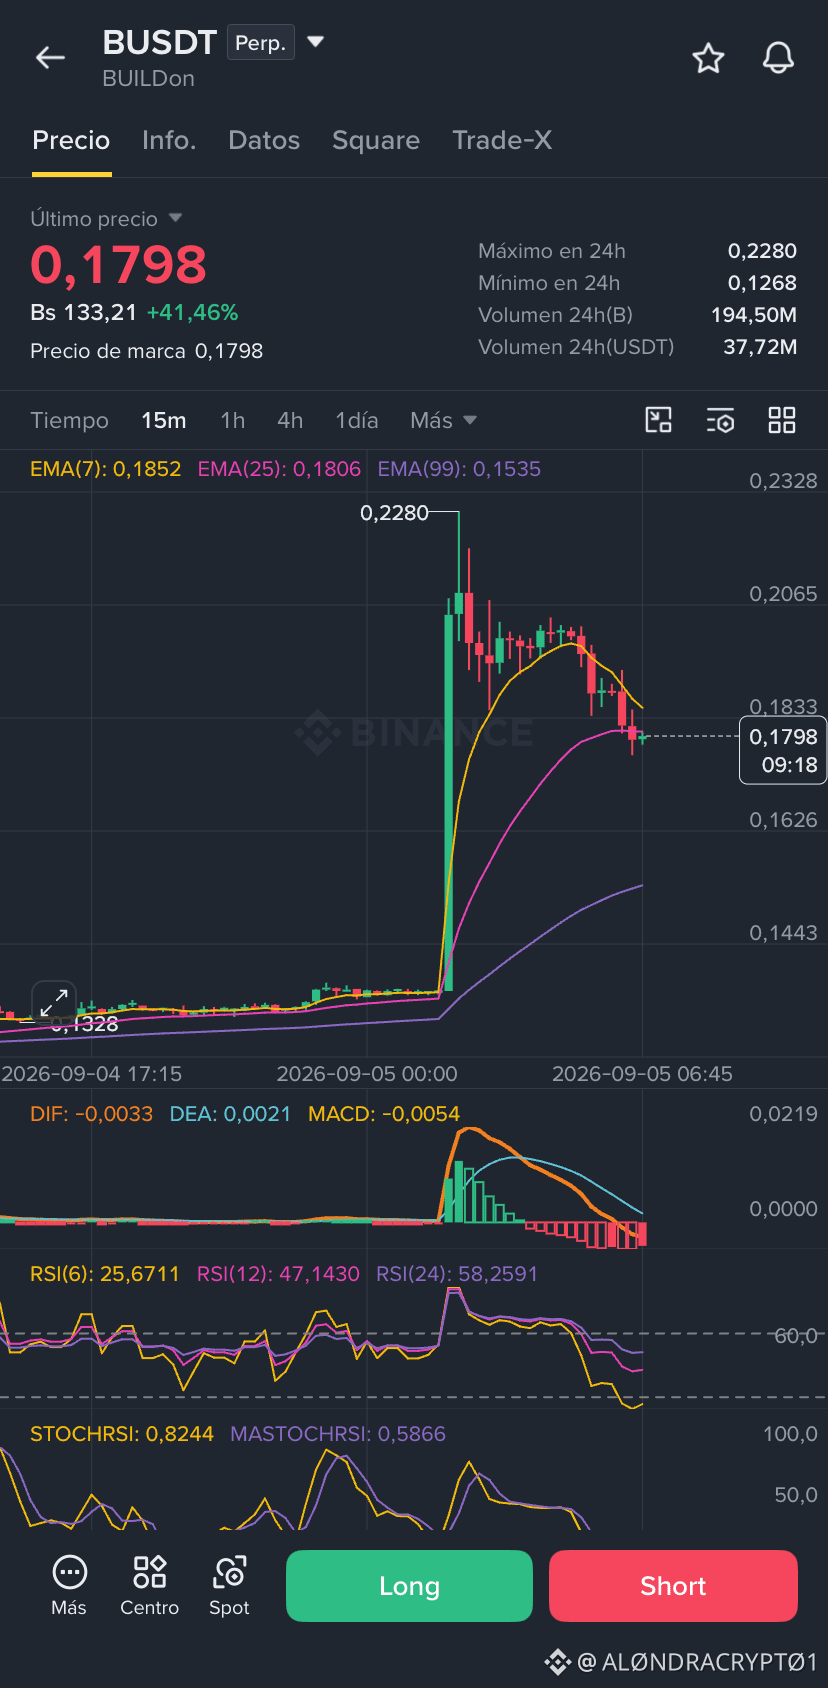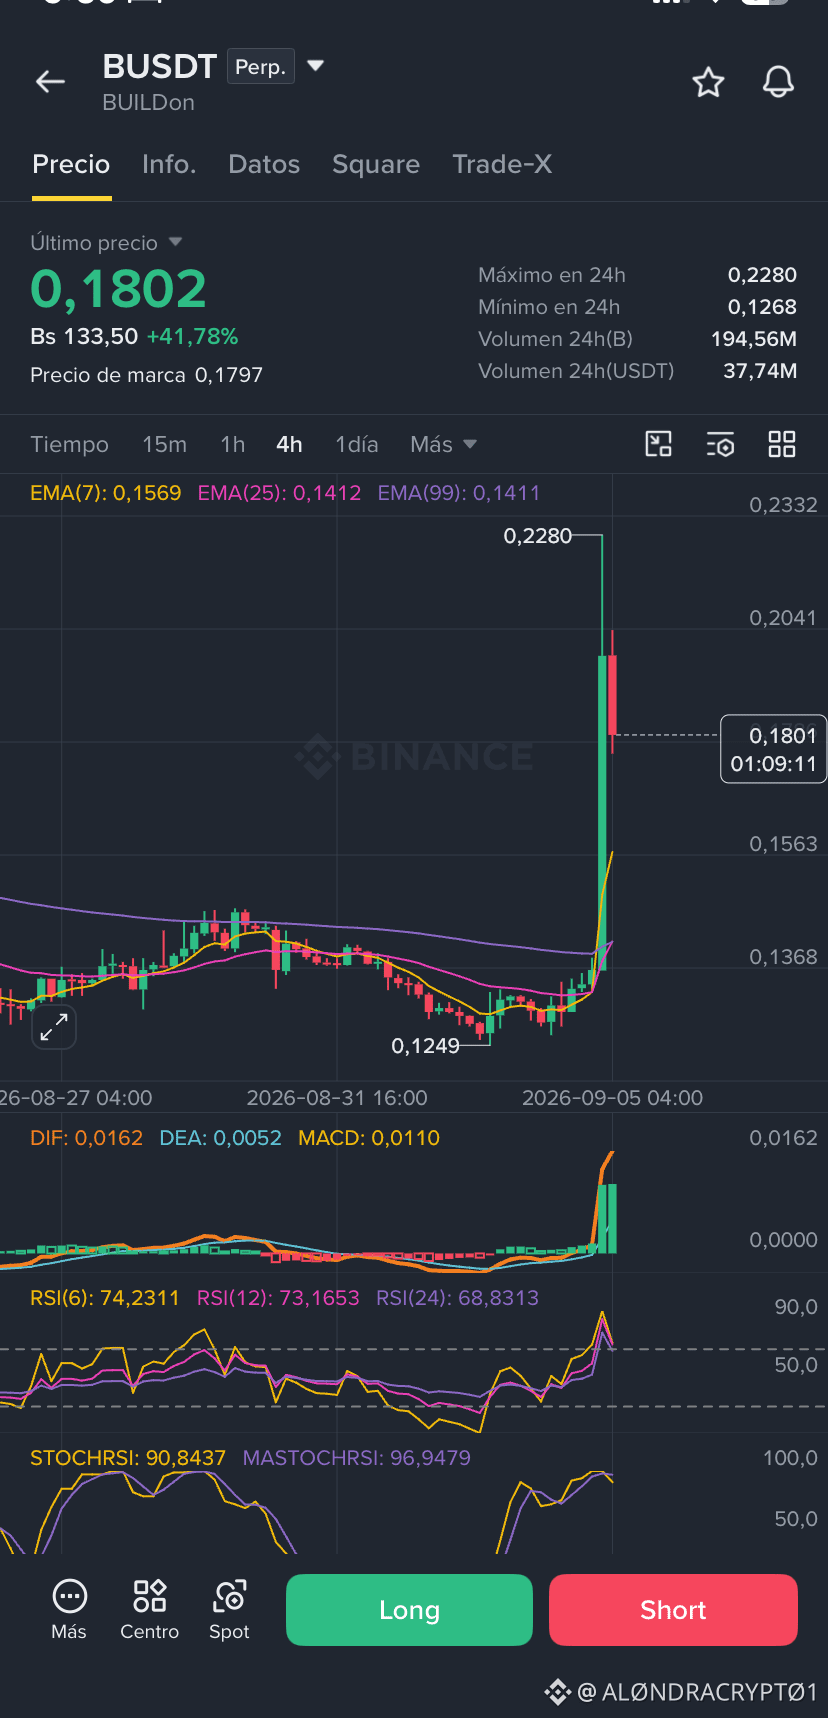

The current market for $B shows a high in the 0.2280 area and a recent low near 0.1268, currently trading around 0.1797. Reviewing behavior on 15-minute and 1-hour timeframes, the price is evaluating levels after the impulse,. Each trader analyzes whether they prefer to set their alerts strategically at the resistance of 0.2280 to watch for a possible bullish extension or at the key support of 0.1260 to observe how the price reacts.
steps to confirm that long entry:
1. StochRSI crossover: Wait for the StochRSI lines to cross upward, exiting the oversold zone (below 20), confirming that the short-term bearish momentum is fading.
2. Moving Average Breakout: Observe that the price recovers and holds above the fast moving averages (such as the 7- and 25-period EMA) on 15-minute timeframes.
3. Candle Close and Volume: Confirm the entry only when you see a bullish candle with a solid body backed by buying volume that breaks the small local resistance structure.
Do you prefer to wait for it to break the highs or will you watch the supports below?
DYOR ALWAYS DO YOUR OWN RESEARCH 😉
#AnalisisTecnico
steps to confirm that long entry:
1. StochRSI crossover: Wait for the StochRSI lines to cross upward, exiting the oversold zone (below 20), confirming that the short-term bearish momentum is fading.
2. Moving Average Breakout: Observe that the price recovers and holds above the fast moving averages (such as the 7- and 25-period EMA) on 15-minute timeframes.
3. Candle Close and Volume: Confirm the entry only when you see a bullish candle with a solid body backed by buying volume that breaks the small local resistance structure.
Do you prefer to wait for it to break the highs or will you watch the supports below?
DYOR ALWAYS DO YOUR OWN RESEARCH 😉
#AnalisisTecnico