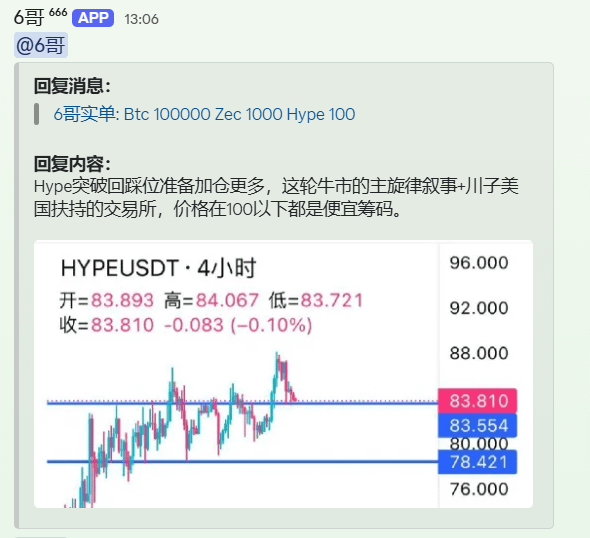

In the evolution of strong-trend assets, the pullback confirmation after breaking above prior highs is often the best window for a second-stage entry. Well-known analyst 6 Ge has recently released his technical assessment and adding-position plan for the HYPEUSDT 4-hour chart.
📊 Breakdown of the market structure and narrative logic:
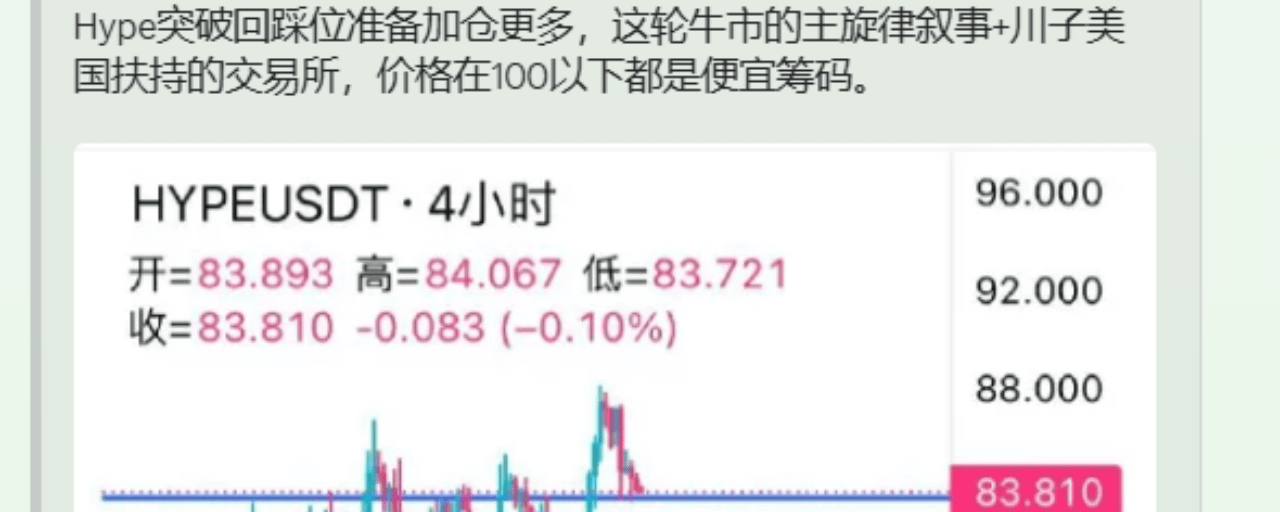
Breakout-pullback technical pattern: From the 4-hour chart of HYPEUSDT, after a successful surge and breakout, price has pulled back and is now precisely holding at the breakout-to-support zone of 83.554–83.810. The validity of this support is being tested, and it is a classic bullish “breakout - pullback - confirmation” structure.
Macro and fundamental narrative: 6Ge pointed out that HYPE carries the core main theme narrative of this bull market, with strong platform ecosystem and regulatory endorsement, and its structural logic is extremely solid.
Long-term target anchor: The strategy sets HYPE's mid-term target at 100, and believes that price zones below 100 are accumulation ranges with a high risk-reward ratio.
💡 Trading logic summary:
Not chasing the first leg of an upward breakout, but patiently waiting for the price to pull back to a key support line and stabilize before adding positions again, is a typical approach in trend-following trading that balances safety margin and returns.
Do you think HYPE, after stabilizing above the 83.5 support line, can break through 90 and directly challenge the 100 mark? Feel free to discuss in the comments.