DASH: Tests Major Resistance Cluster at $70–$72 – Dual-Scenario Playbook Targeting the $100 Milestone
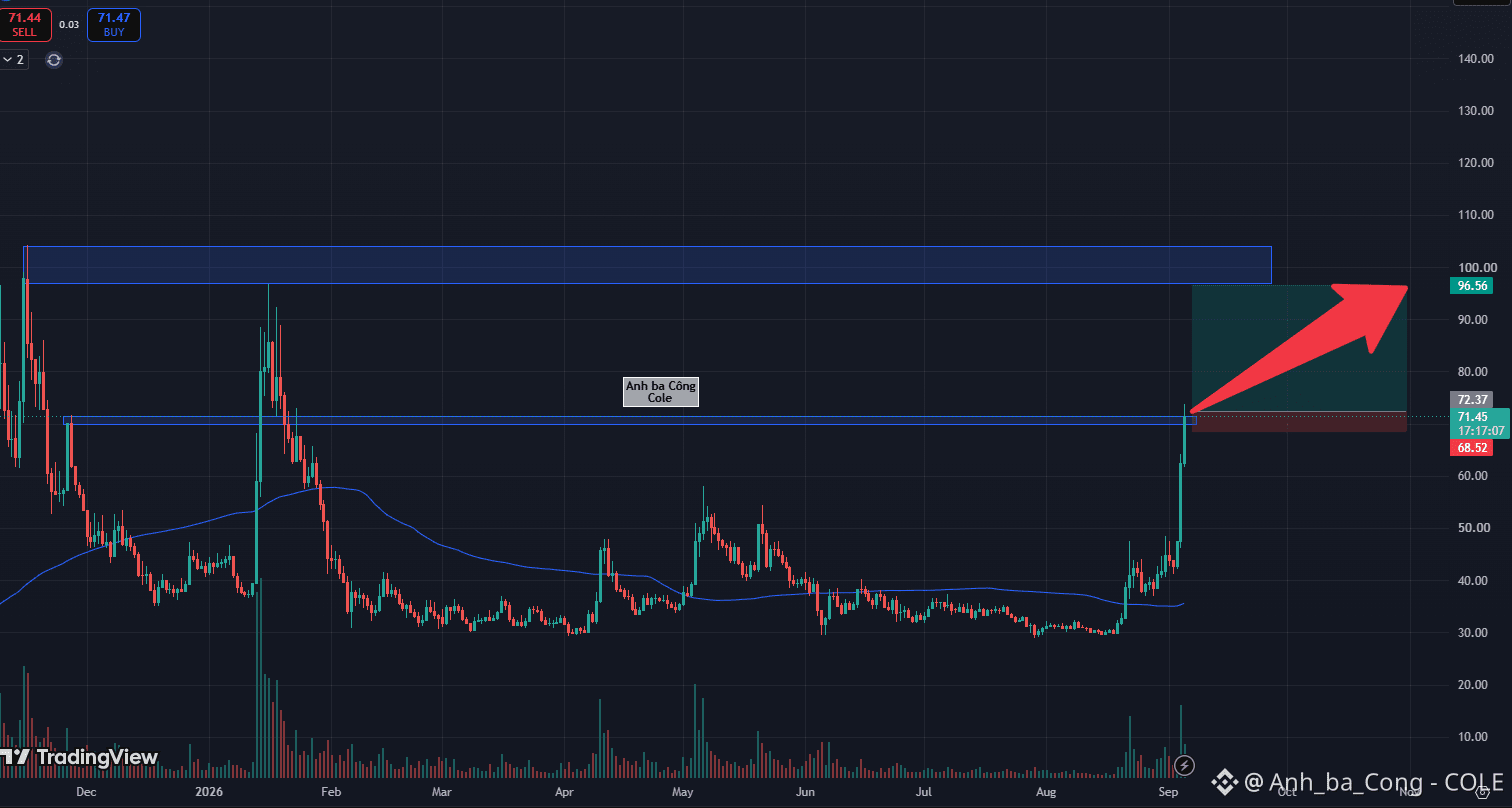
DASH is staging a massive vertical rally on the daily timeframe following consecutive days of aggressive accumulation out of its multi-month consolidation base. However, this bullish momentum is now encountering a critical structural checkpoint as daily price action directly collides with the formidable $70–$72 horizontal resistance ceiling.
Based on the visual data from the daily chart , the $70–$72 zone represents a pivotal historical inflection area where heavy sell-side supply previously emerged. With price candles now trading well above the rising dynamic MA100 trendline, candle behavior around this structural barrier will determine the next expansion leg. While broader market tailwinds favor an upward continuation, disciplined execution requires preparing for both technical outcomes based on confirmed daily closes.
The optimal strategy is to utilize the $70–$72 resistance band as a tight risk-defining boundary. If daily candles confirm a decisive close above $72, initiate momentum Long positions targeting the psychological round-number ceiling at $100. Conversely, if buy-side momentum stalls and price action closes beneath $70, execute a counter-trend Short scalp to capture the corrective cool-off toward the $50 support floor, using the local resistance cluster for tight stop-loss placement.
Disclaimer: This is not financial advice, DYOR. $DASH $BULLA $4 #Colecolen
DASH is staging a massive vertical rally on the daily timeframe following consecutive days of aggressive accumulation out of its multi-month consolidation base. However, this bullish momentum is now encountering a critical structural checkpoint as daily price action directly collides with the formidable $70–$72 horizontal resistance ceiling.
Based on the visual data from the daily chart , the $70–$72 zone represents a pivotal historical inflection area where heavy sell-side supply previously emerged. With price candles now trading well above the rising dynamic MA100 trendline, candle behavior around this structural barrier will determine the next expansion leg. While broader market tailwinds favor an upward continuation, disciplined execution requires preparing for both technical outcomes based on confirmed daily closes.
The optimal strategy is to utilize the $70–$72 resistance band as a tight risk-defining boundary. If daily candles confirm a decisive close above $72, initiate momentum Long positions targeting the psychological round-number ceiling at $100. Conversely, if buy-side momentum stalls and price action closes beneath $70, execute a counter-trend Short scalp to capture the corrective cool-off toward the $50 support floor, using the local resistance cluster for tight stop-loss placement.
Disclaimer: This is not financial advice, DYOR. $DASH $BULLA $4 #Colecolen