【 82300 After the surge and pullback, are BTC top signals getting stronger? Is 73000-75000 still the buy-in opportunity to wait for?】
The correction is becoming more and more obvious, but this time don’t expect BTC to drop easily.
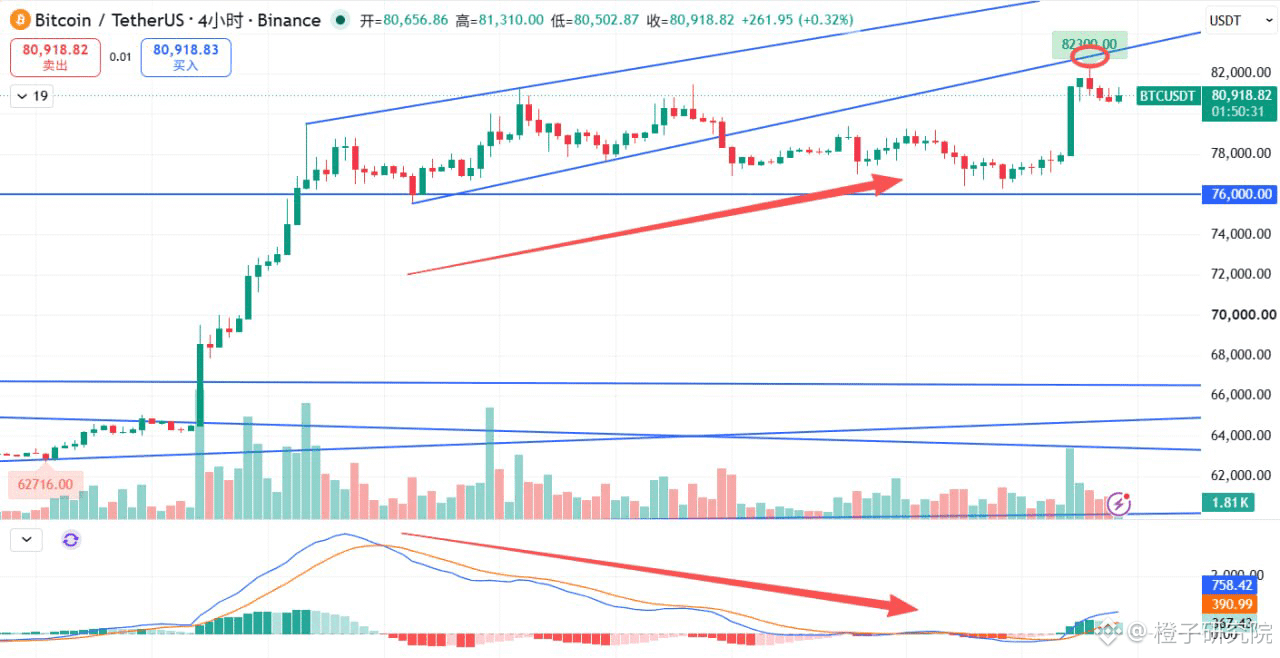
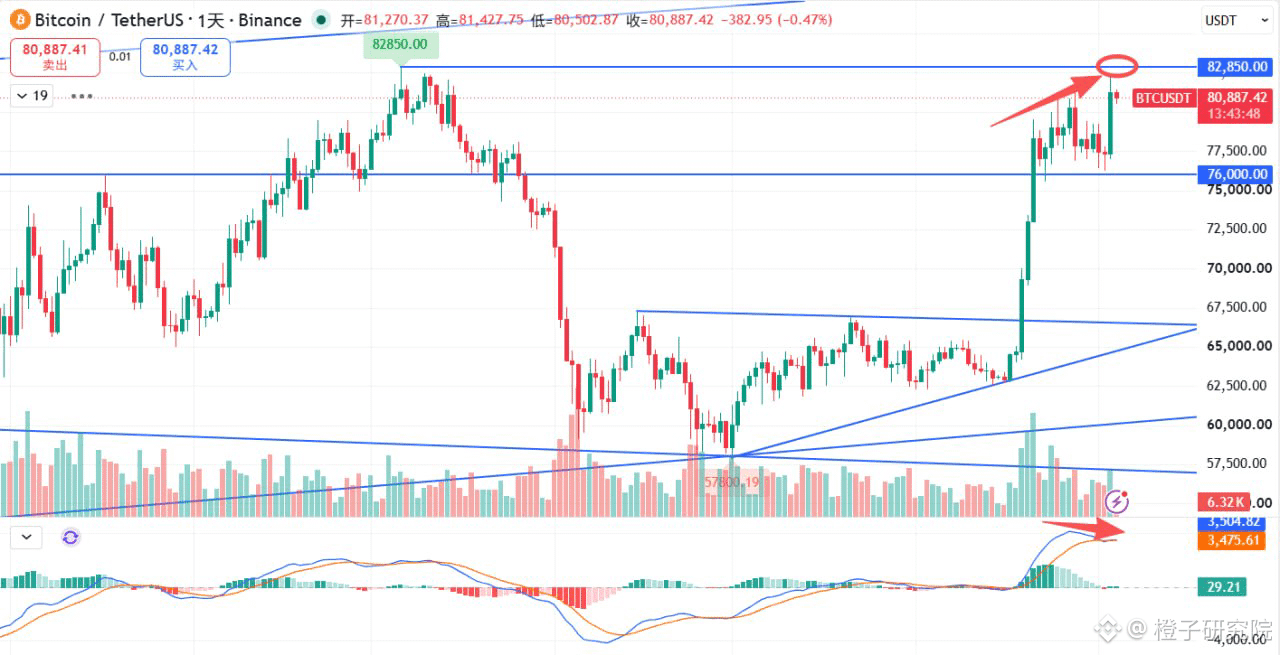
Yesterday we already said that after the surge and pullback at 82300, multiple 4-hour bearish divergences had appeared, and the 8-hour and daily charts had also started to form a top pattern [as shown in Figures 1 and 2].
Looking at it again today, the correction signals have strengthened further.
But the biggest problem here is: the overall trend has not completely broken down yet!
So this pullback is very likely not going to be a straight-line decline, but a complex correction involving repeated tug-of-war, constant spike wicks, and ongoing shakeouts.
That is also why my current view remains relatively clear:
Do not chase the top, and do not chase the short.
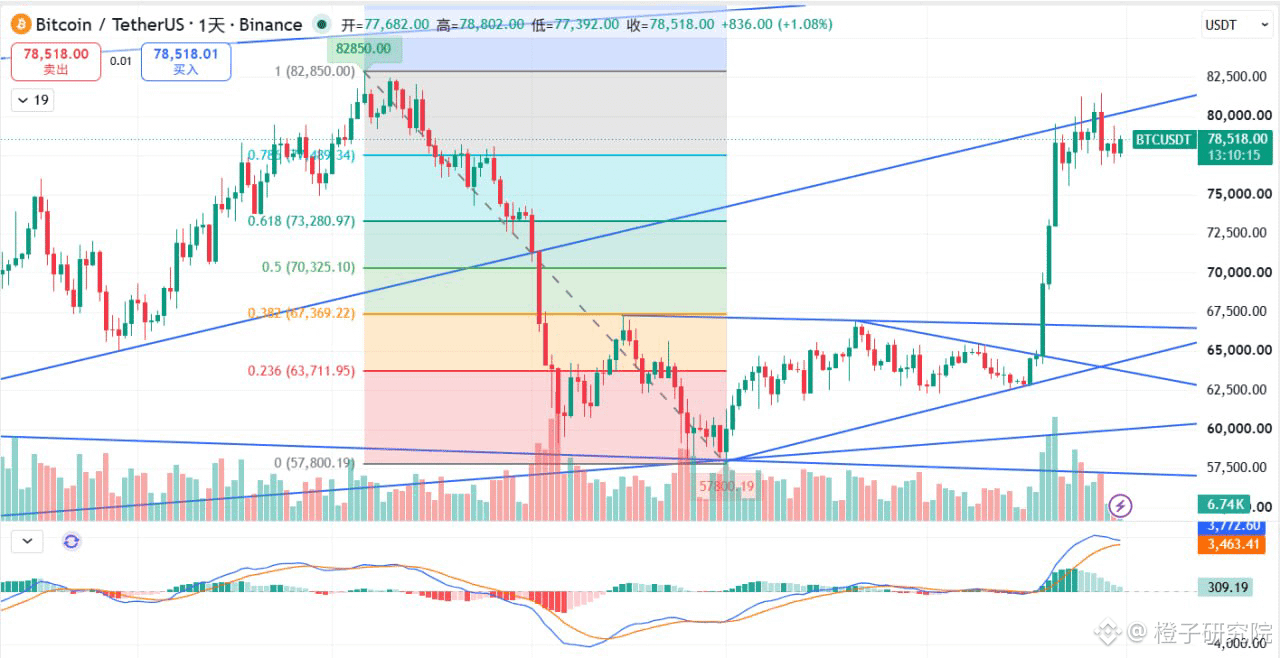
What is truly worth our attention is still the 73000–75000 area we have repeatedly mentioned before. This corresponds to around the Fibonacci 0.618 level. If price can return to this area later, then we can combine it with the market conditions at that time to judge whether there will be another buy-in opportunity [as shown in Figure 3].
As for the time cycle, I believe the period around the middle of the month, before and after the legislation proposal, may be the key turning point that truly changes the rhythm of the market.
Before that, both bulls and bears are likely to feel very uncomfortable.
Bulls are afraid of a drop, bears are afraid of a rally; chasing the rise can easily get hit, and chasing the short can also easily get reversed and squeezed.
So right now, the most important thing is not to predict up or down, but to protect your position and pace, and wait for a real major change to appear.
Trading pace: currently, my personal and community position is 40%, and yesterday I reduced 20% of the position at the high level of 81400.
#比特币以太坊触及数月高点 $BTC $ETH $SOL
The correction is becoming more and more obvious, but this time don’t expect BTC to drop easily.
Yesterday we already said that after the surge and pullback at 82300, multiple 4-hour bearish divergences had appeared, and the 8-hour and daily charts had also started to form a top pattern [as shown in Figures 1 and 2].
Looking at it again today, the correction signals have strengthened further.
But the biggest problem here is: the overall trend has not completely broken down yet!
So this pullback is very likely not going to be a straight-line decline, but a complex correction involving repeated tug-of-war, constant spike wicks, and ongoing shakeouts.
That is also why my current view remains relatively clear:
Do not chase the top, and do not chase the short.
What is truly worth our attention is still the 73000–75000 area we have repeatedly mentioned before. This corresponds to around the Fibonacci 0.618 level. If price can return to this area later, then we can combine it with the market conditions at that time to judge whether there will be another buy-in opportunity [as shown in Figure 3].
As for the time cycle, I believe the period around the middle of the month, before and after the legislation proposal, may be the key turning point that truly changes the rhythm of the market.
Before that, both bulls and bears are likely to feel very uncomfortable.
Bulls are afraid of a drop, bears are afraid of a rally; chasing the rise can easily get hit, and chasing the short can also easily get reversed and squeezed.
So right now, the most important thing is not to predict up or down, but to protect your position and pace, and wait for a real major change to appear.
Trading pace: currently, my personal and community position is 40%, and yesterday I reduced 20% of the position at the high level of 81400.
#比特币以太坊触及数月高点 $BTC $ETH $SOL