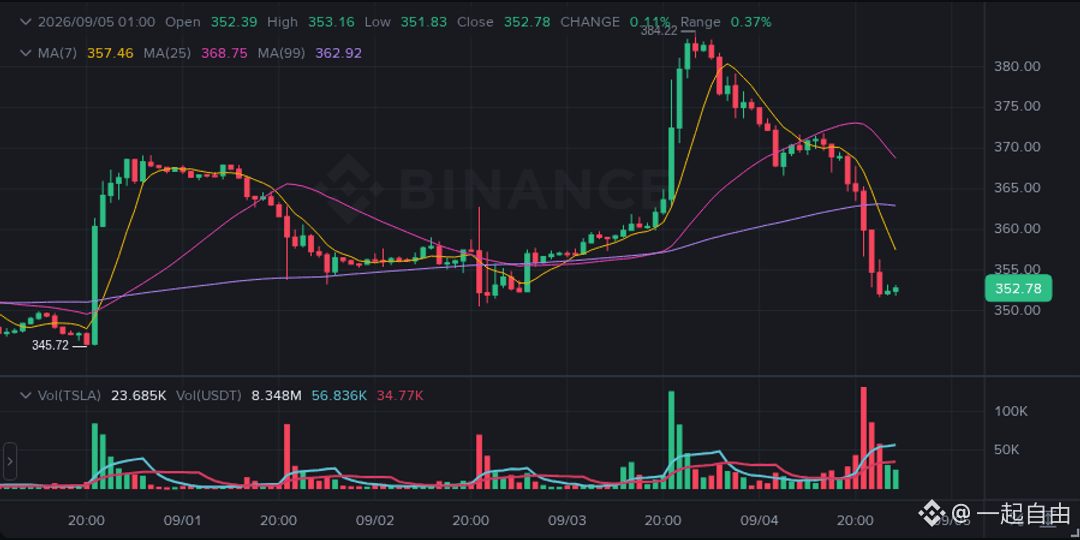
1-hour rise of 0.1%, but the 24 completed 1-hour candlesticks are down 7.8%: is this short-term rebound a repair, or just a pause in weakness?
As of 01:58, $TSLA is quoted at 352.74 USDT, down 7.9% over the past 24 hours.
The completed 1-hour candlestick shows a 0.1% rise.
The completed 4-hour candlestick shows a 3.4% decline.
The completed intraday candlestick performance shows the 24 completed 1-hour candlesticks down 7.8%.
Recent quoted trading volume has accelerated to 2.54x.
Open interest increased 37.0% over 4 hours.
The funding rate is +0.0399%, with longs paying shorts.
The account long-short ratio is 3.10.
The top trader position ratio is 2.02.
The 1-hour rise of 0.1% contrasts with the 4-hour decline of 3.4% and the 24 completed 1-hour candlesticks down 7.8%, and together with the 37.0% increase in open interest over 4 hours, this suggests that the short-term repair has not erased the weaker signals from the longer timeframe.
During the period when the 24 completed 1-hour candlesticks fell 7.8%, open interest increased 37.0% over 4 hours and trading volume accelerated to 2.54x, suggesting that after new leverage entered, sensitivity to opposite-side volatility may have increased; if liquidation occurs, volatility could be amplified.
I think it is unwise to focus only on the short-term 1-hour rise of 0.1%. The 24 completed 1-hour candlesticks down 7.8% still form the weak backdrop, while the 37.0% increase in open interest over 4 hours, the +0.0399% funding rate, and the 3.10 account long-short ratio all point to a more sensitive environment after leverage participation has increased. There is still no evidence that this rebound can continue; if volatility turns the other way, leveraged liquidations could speed things up.
If the 15-minute close falls below 352.08, it will support the current bearish interpretation.
If the 15-minute close rises above 365.62, it will invalidate the current bearish interpretation.
When short-term rebound conflicts with intraday weakness, would you prioritize changes in open interest, or the account and top trader position ratios?
Trading plan:
Direction: Short
Trigger price: 352.08 (15-minute close below)
Cancellation condition: 15-minute close above 365.62
Target 1: 331.77
Target 2: 322.29
Why is it set this way?
These levels are taken only from the completed hourly structure; before the close is confirmed, intraday noise is not treated as a breakout.
Trading volume and leverage only serve as auxiliary confirmation; once the structure fails, the original interpretation is abandoned.
Click here to trade 👇
$TSLA #美股 #longshortdata
As of 01:58, $TSLA is quoted at 352.74 USDT, down 7.9% over the past 24 hours.
The completed 1-hour candlestick shows a 0.1% rise.
The completed 4-hour candlestick shows a 3.4% decline.
The completed intraday candlestick performance shows the 24 completed 1-hour candlesticks down 7.8%.
Recent quoted trading volume has accelerated to 2.54x.
Open interest increased 37.0% over 4 hours.
The funding rate is +0.0399%, with longs paying shorts.
The account long-short ratio is 3.10.
The top trader position ratio is 2.02.
The 1-hour rise of 0.1% contrasts with the 4-hour decline of 3.4% and the 24 completed 1-hour candlesticks down 7.8%, and together with the 37.0% increase in open interest over 4 hours, this suggests that the short-term repair has not erased the weaker signals from the longer timeframe.
During the period when the 24 completed 1-hour candlesticks fell 7.8%, open interest increased 37.0% over 4 hours and trading volume accelerated to 2.54x, suggesting that after new leverage entered, sensitivity to opposite-side volatility may have increased; if liquidation occurs, volatility could be amplified.
I think it is unwise to focus only on the short-term 1-hour rise of 0.1%. The 24 completed 1-hour candlesticks down 7.8% still form the weak backdrop, while the 37.0% increase in open interest over 4 hours, the +0.0399% funding rate, and the 3.10 account long-short ratio all point to a more sensitive environment after leverage participation has increased. There is still no evidence that this rebound can continue; if volatility turns the other way, leveraged liquidations could speed things up.
If the 15-minute close falls below 352.08, it will support the current bearish interpretation.
If the 15-minute close rises above 365.62, it will invalidate the current bearish interpretation.
When short-term rebound conflicts with intraday weakness, would you prioritize changes in open interest, or the account and top trader position ratios?
Trading plan:
Direction: Short
Trigger price: 352.08 (15-minute close below)
Cancellation condition: 15-minute close above 365.62
Target 1: 331.77
Target 2: 322.29
Why is it set this way?
These levels are taken only from the completed hourly structure; before the close is confirmed, intraday noise is not treated as a breakout.
Trading volume and leverage only serve as auxiliary confirmation; once the structure fails, the original interpretation is abandoned.
Click here to trade 👇
$TSLA #美股 #longshortdata