$BTC Circle of Finance Scholar: Bitcoin (BTC) bull market on 9.5 is not a blind bullish market; what are the survival rules during a high-level consolidation phase? Latest market analysis and trading suggestions explained
Bitcoin is currently at 79500. Is another round of pullback coming? The previous strong rally directly heated up market sentiment, and many people chased prices at the top, now feeling uneasy as the market swings back and forth. When prices rise, people fear missing out; when they fall, they fear being trapped. This is the normal state for most traders. Right now, price is stuck around 79500. It has just touched the 82282 high and then pulled back under pressure, bringing the tug-of-war between bulls and bears to a critical turning point. Do not be misled by a few big bullish candles, and do not turn bearish on the whole market just because of a few bearish candles.
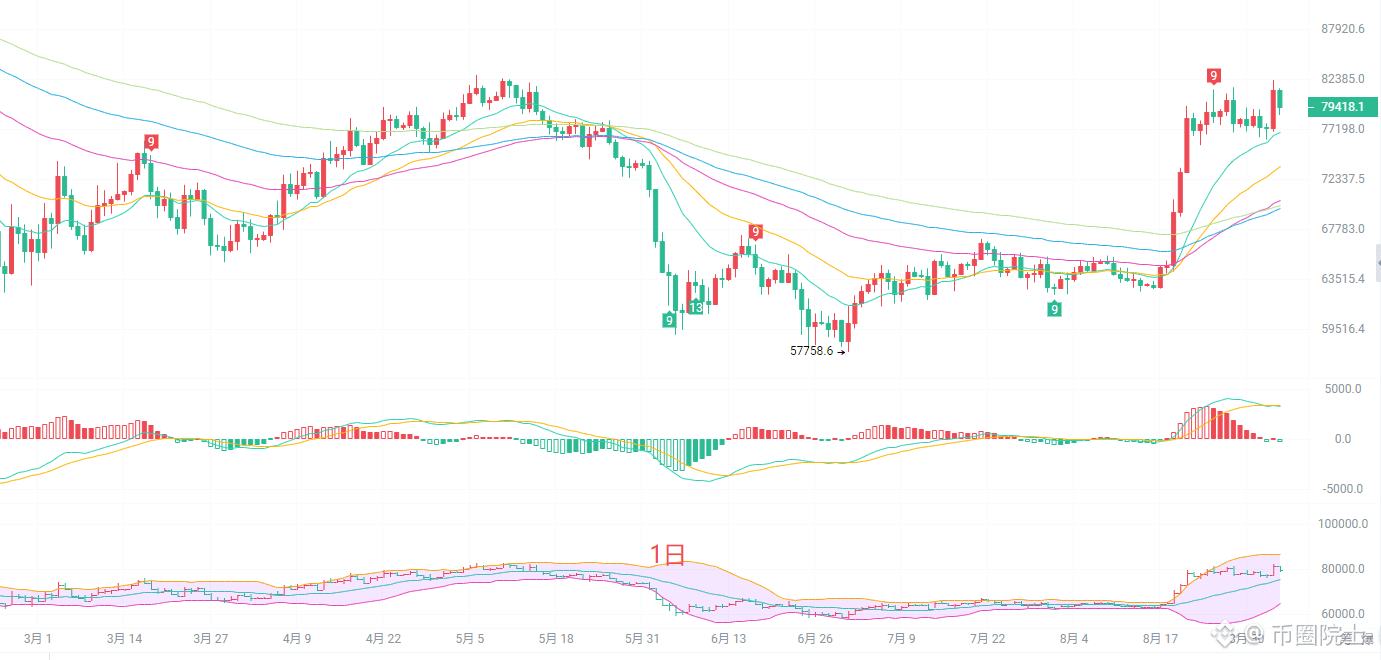
On the daily chart, all moving averages are aligned in a bullish structure. The short-term EMA15 and EMA30 are firmly supporting price, the medium-term moving averages are still trending upward, and the overall bullish trend structure has not been broken. The MACD red histogram is beginning to shrink, and DIF is showing signs of turning down toward DEA, indicating that upward momentum is weakening. On the Bollinger Bands, price is currently trading between the upper and middle bands, with upper-band resistance at 86485 and middle-band support at 75586. As long as the daily chart does not effectively break below the middle band, the larger trend remains mildly bullish. However, after consecutive surges, the need for a corrective repair is accumulating. If the key support at 75586 is lost, a deeper retracement space will open up, and 82282 will become a strong short-term resistance level.
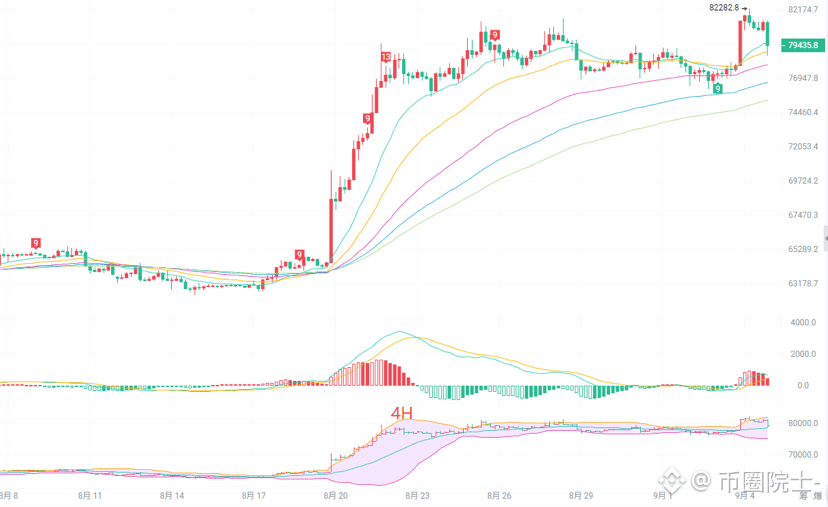
On the 4-hour chart, price is fluctuating around multiple EMA averages. The short-term EMA15 and EMA30 are intertwined, indicating a stalemate between bulls and bears, while the longer-term EMA60 and EMA90 are still pointing upward, keeping the medium-term trend intact. On the 4-hour MACD, DIF has pulled back from high levels, and red and green bars alternate, showing repeated momentum tug-of-war without a clear one-sided trend. The Bollinger Bands have started to narrow, with upper-band resistance at 82083 and lower-band support at 75297. After the pullback, price did not quickly break down, suggesting that buying support below is still acceptable. However, repeated failures to break the high show that bullish breakout strength is weakening. The 4-hour chart is currently in a high-level consolidation phase, and is likely to continue range-bound whipsaw trading while waiting for indicators to repair before choosing a new direction for breakout.
Short-term reference:
Below 77400 to 77800, go long; stop loss 500 points; target 81400 to 83800
Above 81600 to 82000, go short; stop loss 500 points; target 80500 to 79500
Specific operations should be based on real-time order book data
#BTC走势分析
Bitcoin is currently at 79500. Is another round of pullback coming? The previous strong rally directly heated up market sentiment, and many people chased prices at the top, now feeling uneasy as the market swings back and forth. When prices rise, people fear missing out; when they fall, they fear being trapped. This is the normal state for most traders. Right now, price is stuck around 79500. It has just touched the 82282 high and then pulled back under pressure, bringing the tug-of-war between bulls and bears to a critical turning point. Do not be misled by a few big bullish candles, and do not turn bearish on the whole market just because of a few bearish candles.
On the daily chart, all moving averages are aligned in a bullish structure. The short-term EMA15 and EMA30 are firmly supporting price, the medium-term moving averages are still trending upward, and the overall bullish trend structure has not been broken. The MACD red histogram is beginning to shrink, and DIF is showing signs of turning down toward DEA, indicating that upward momentum is weakening. On the Bollinger Bands, price is currently trading between the upper and middle bands, with upper-band resistance at 86485 and middle-band support at 75586. As long as the daily chart does not effectively break below the middle band, the larger trend remains mildly bullish. However, after consecutive surges, the need for a corrective repair is accumulating. If the key support at 75586 is lost, a deeper retracement space will open up, and 82282 will become a strong short-term resistance level.
On the 4-hour chart, price is fluctuating around multiple EMA averages. The short-term EMA15 and EMA30 are intertwined, indicating a stalemate between bulls and bears, while the longer-term EMA60 and EMA90 are still pointing upward, keeping the medium-term trend intact. On the 4-hour MACD, DIF has pulled back from high levels, and red and green bars alternate, showing repeated momentum tug-of-war without a clear one-sided trend. The Bollinger Bands have started to narrow, with upper-band resistance at 82083 and lower-band support at 75297. After the pullback, price did not quickly break down, suggesting that buying support below is still acceptable. However, repeated failures to break the high show that bullish breakout strength is weakening. The 4-hour chart is currently in a high-level consolidation phase, and is likely to continue range-bound whipsaw trading while waiting for indicators to repair before choosing a new direction for breakout.
Short-term reference:
Below 77400 to 77800, go long; stop loss 500 points; target 81400 to 83800
Above 81600 to 82000, go short; stop loss 500 points; target 80500 to 79500
Specific operations should be based on real-time order book data
#BTC走势分析