Trading Idea | 9/4 23:21
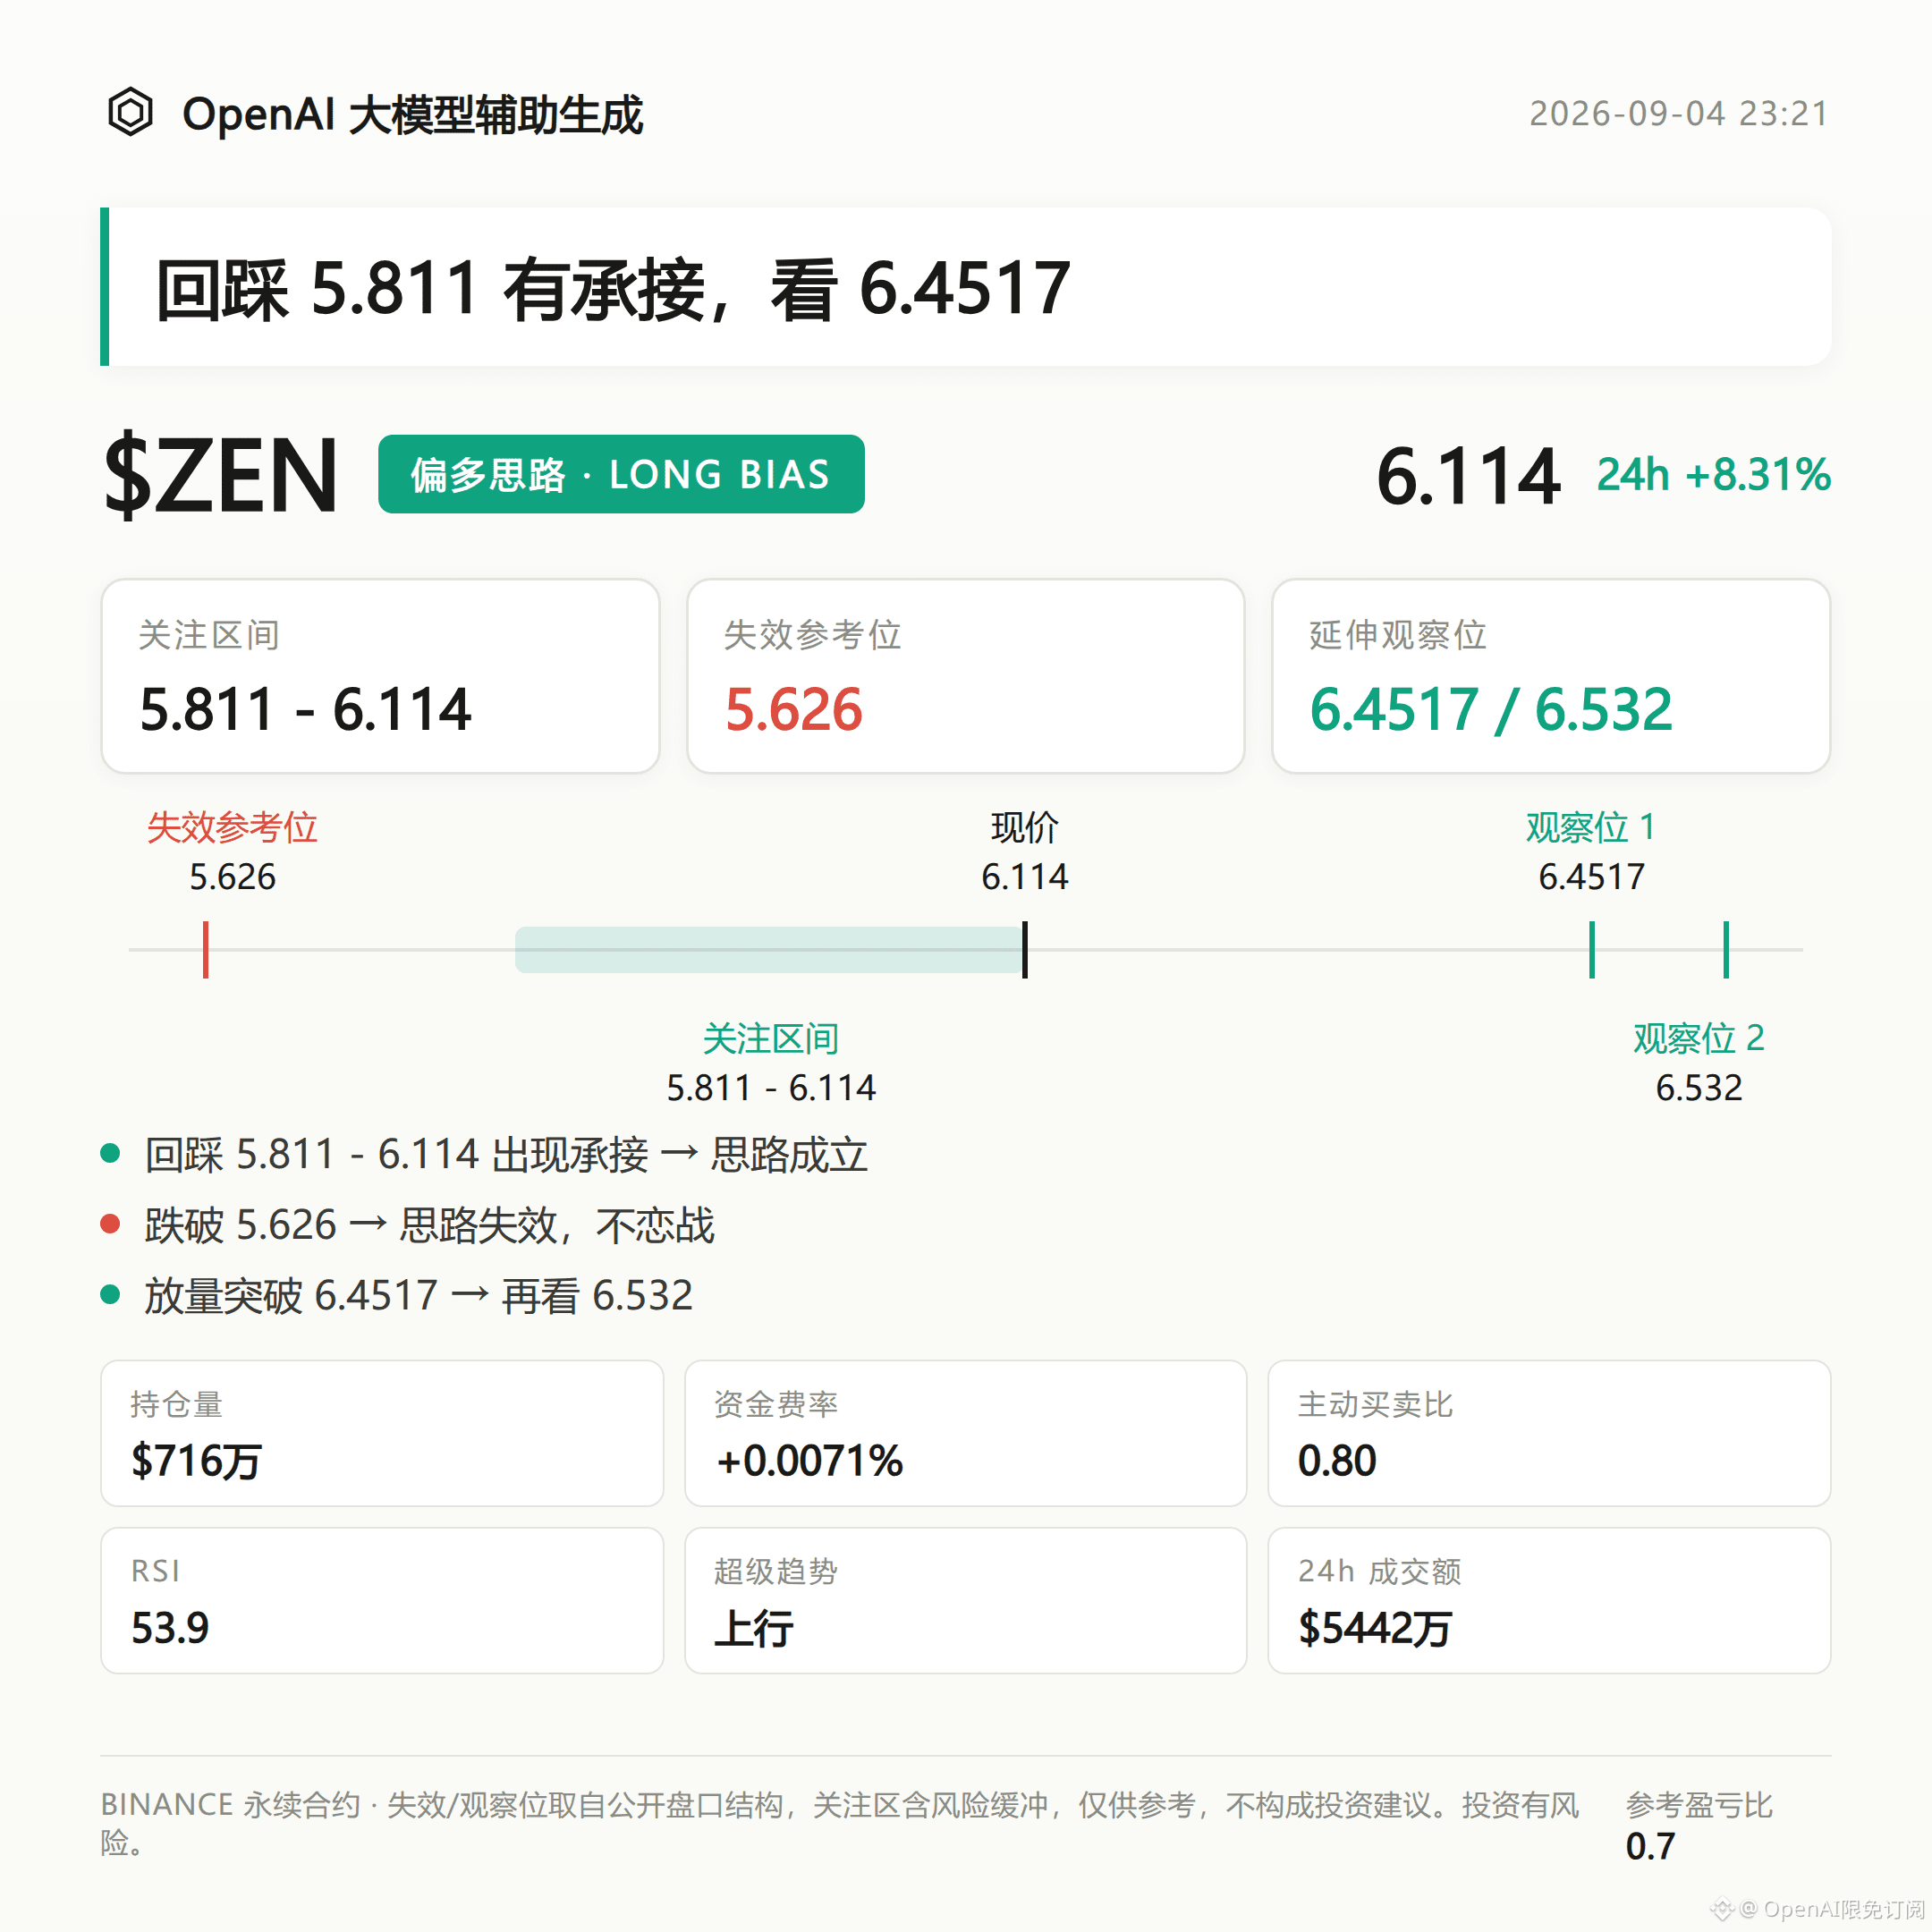
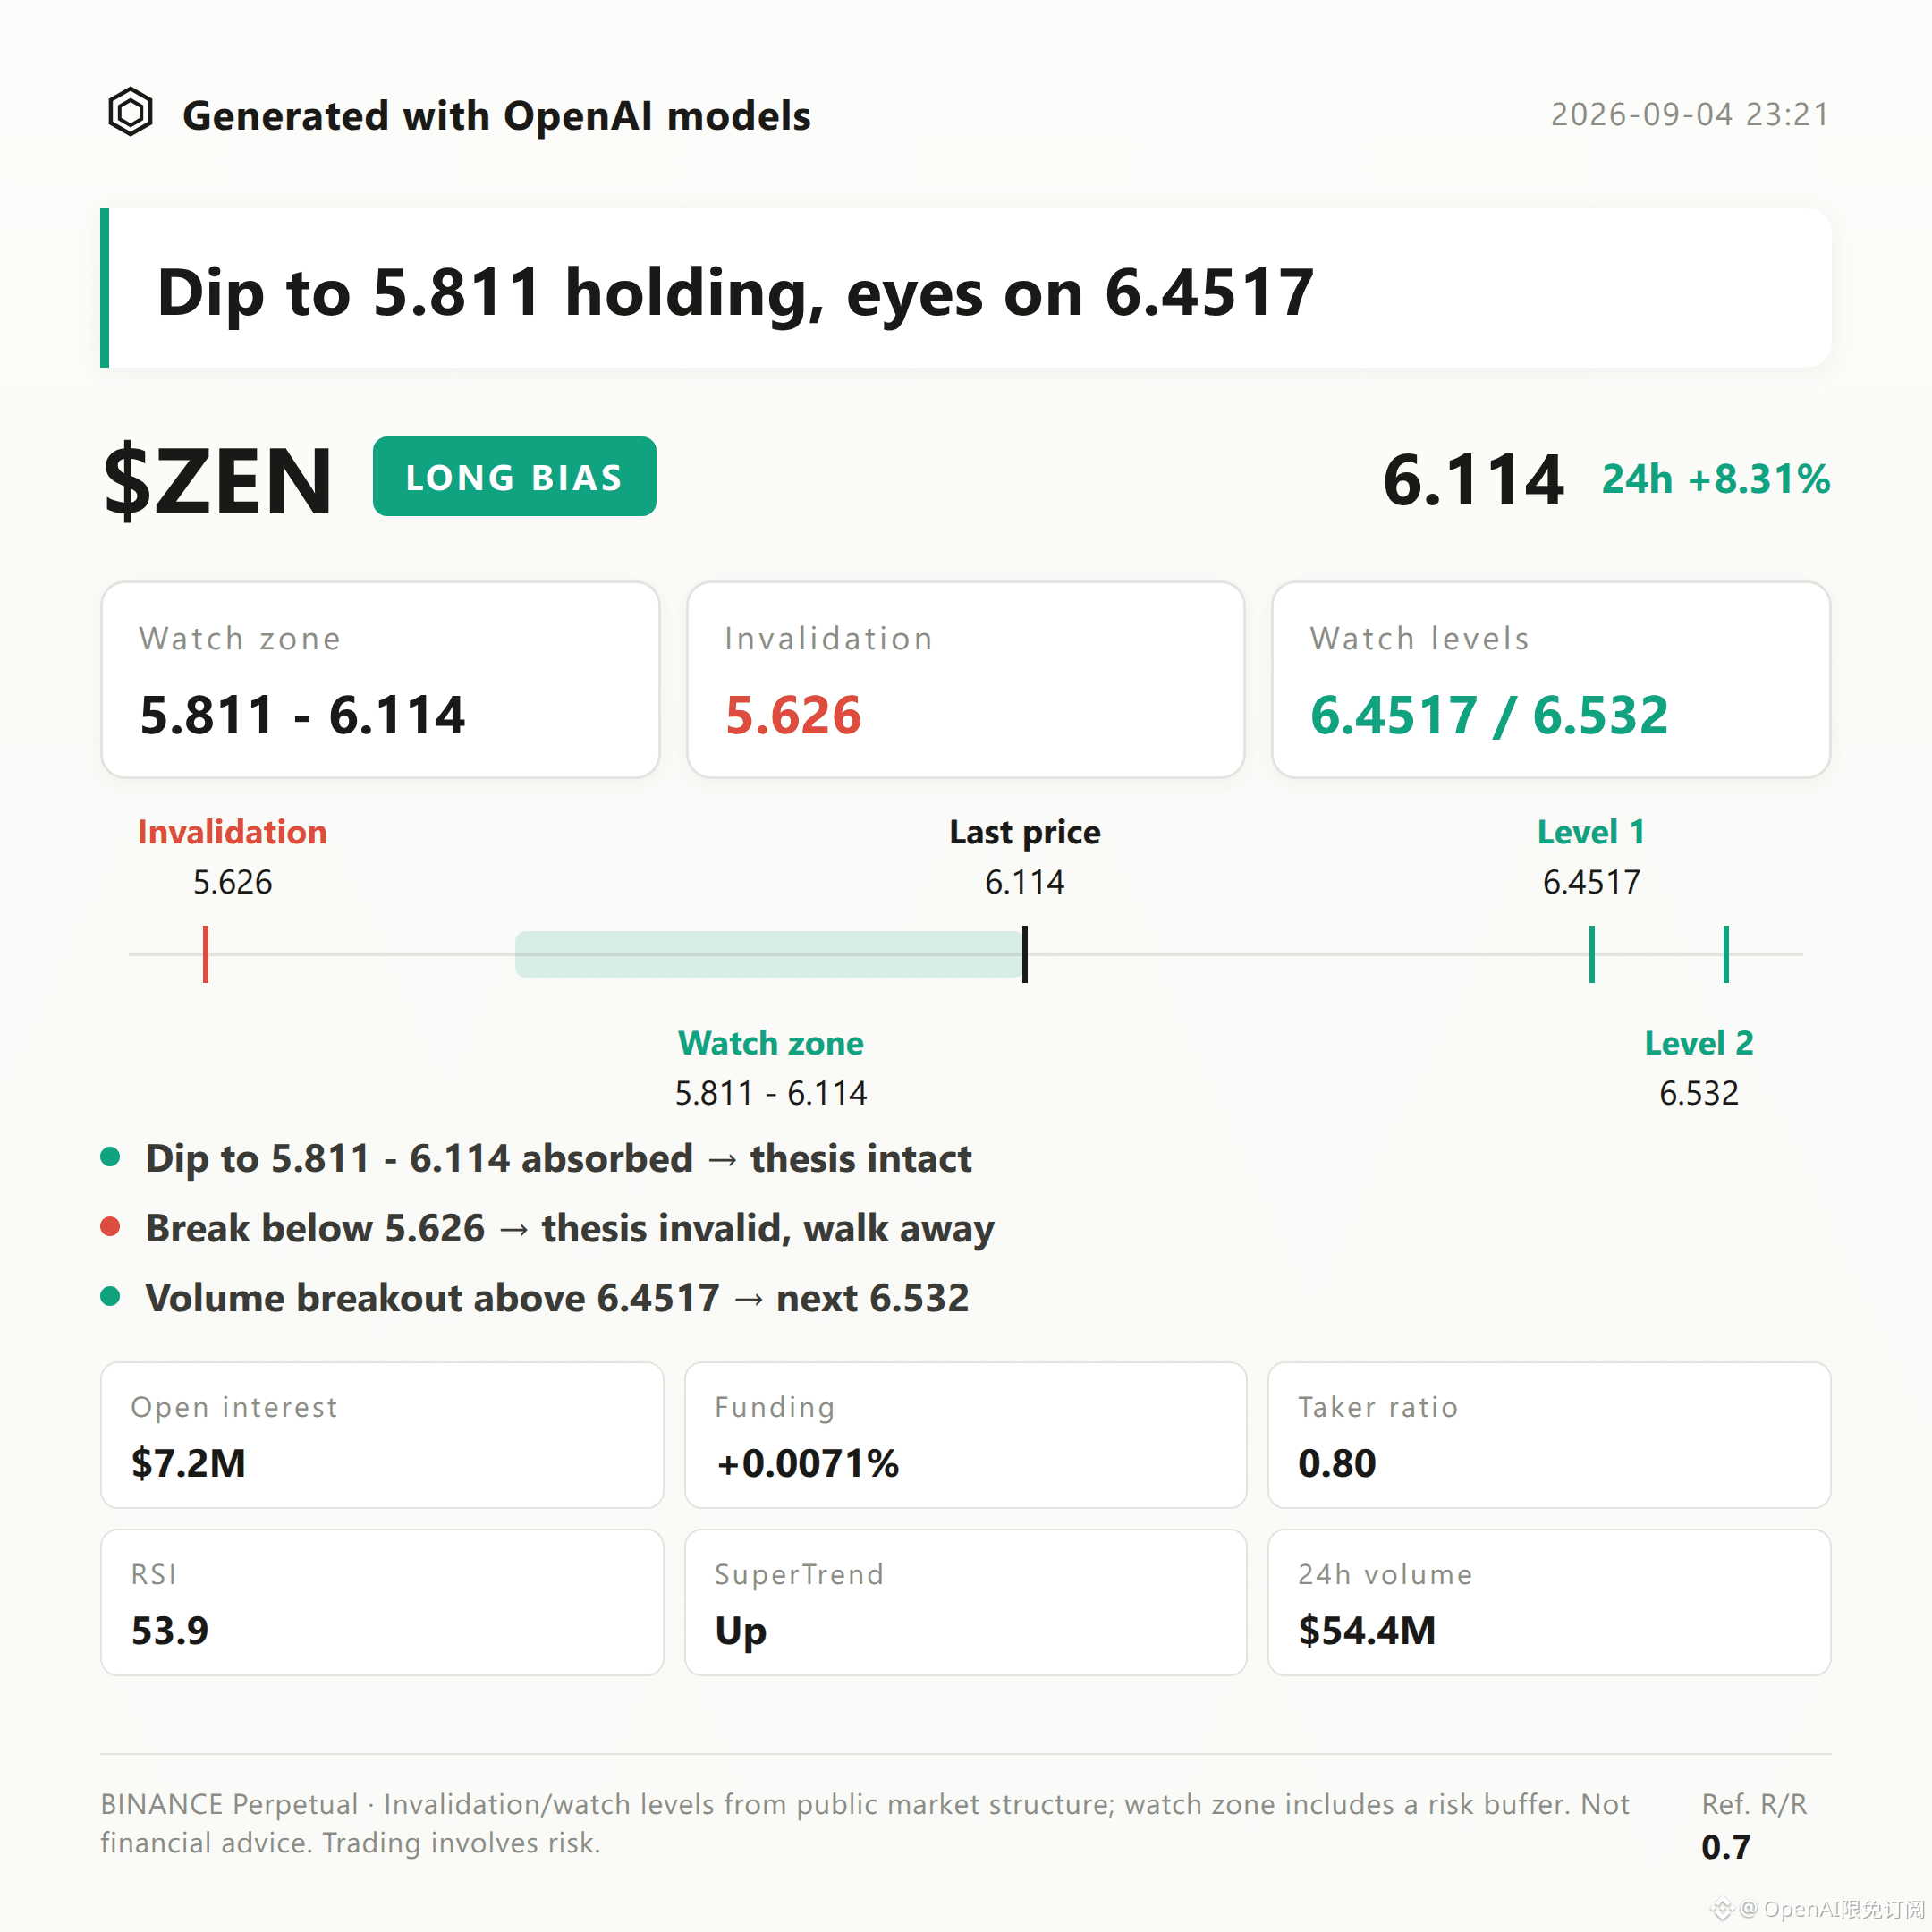
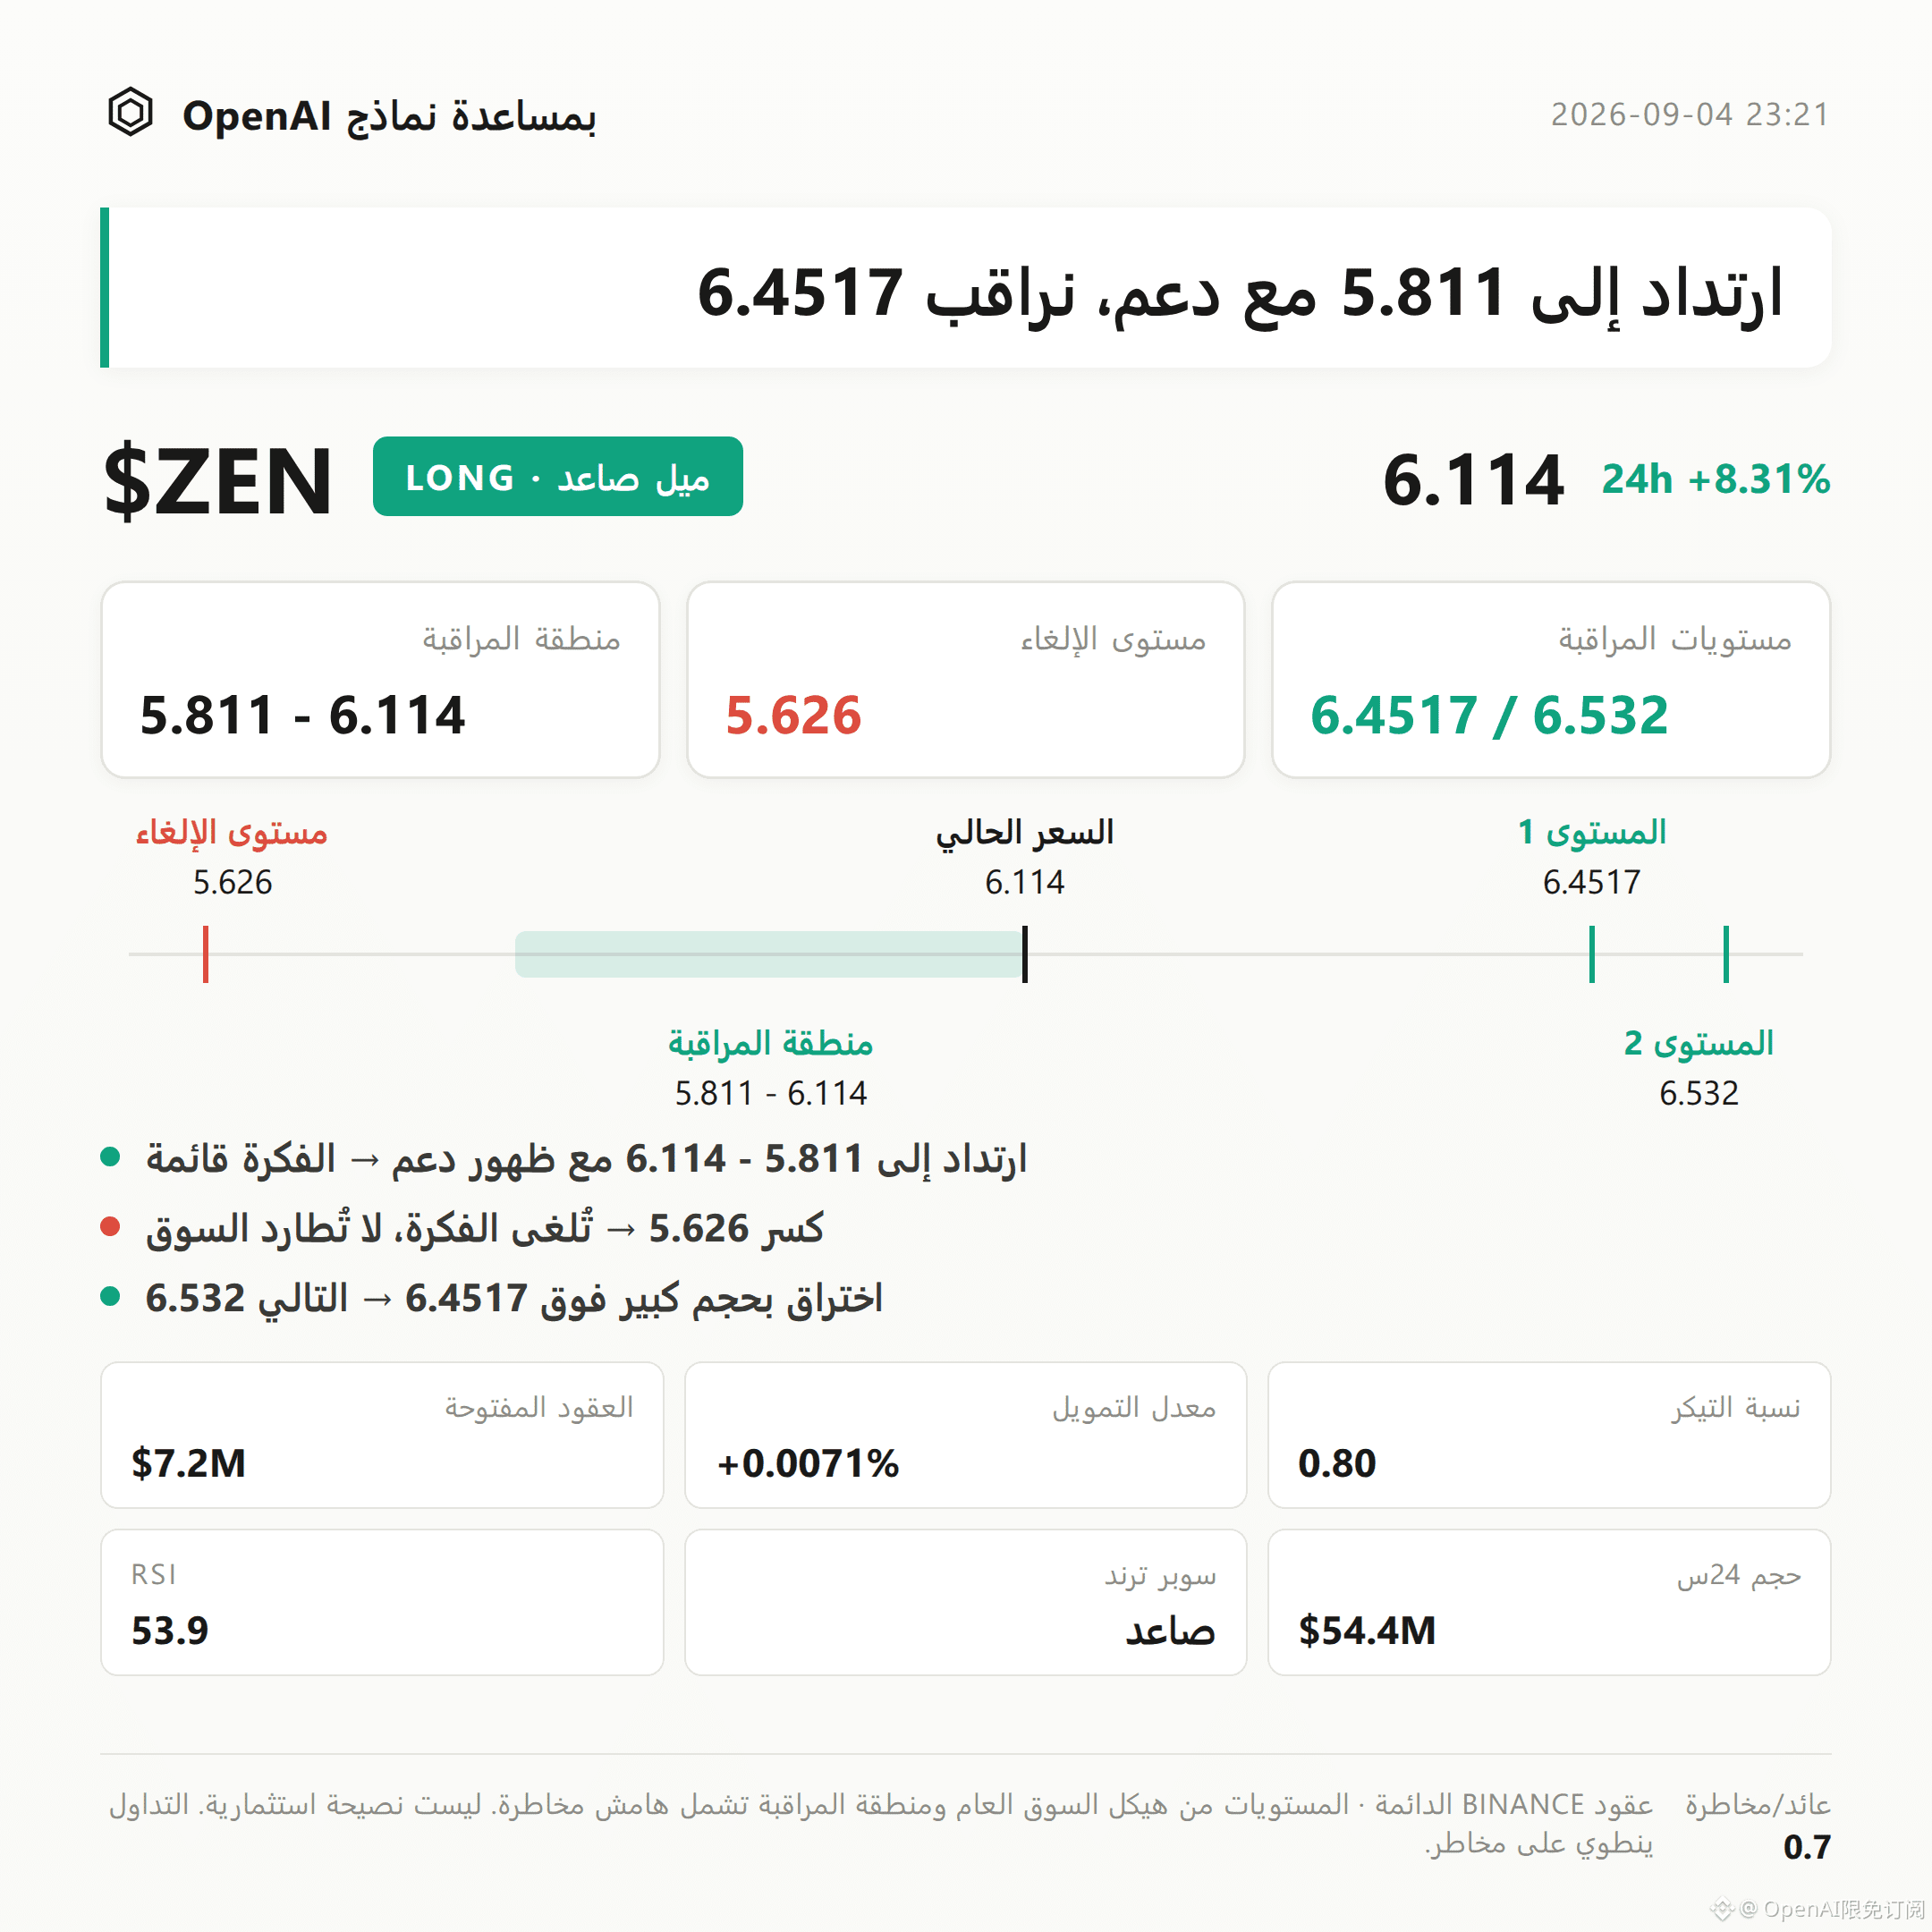
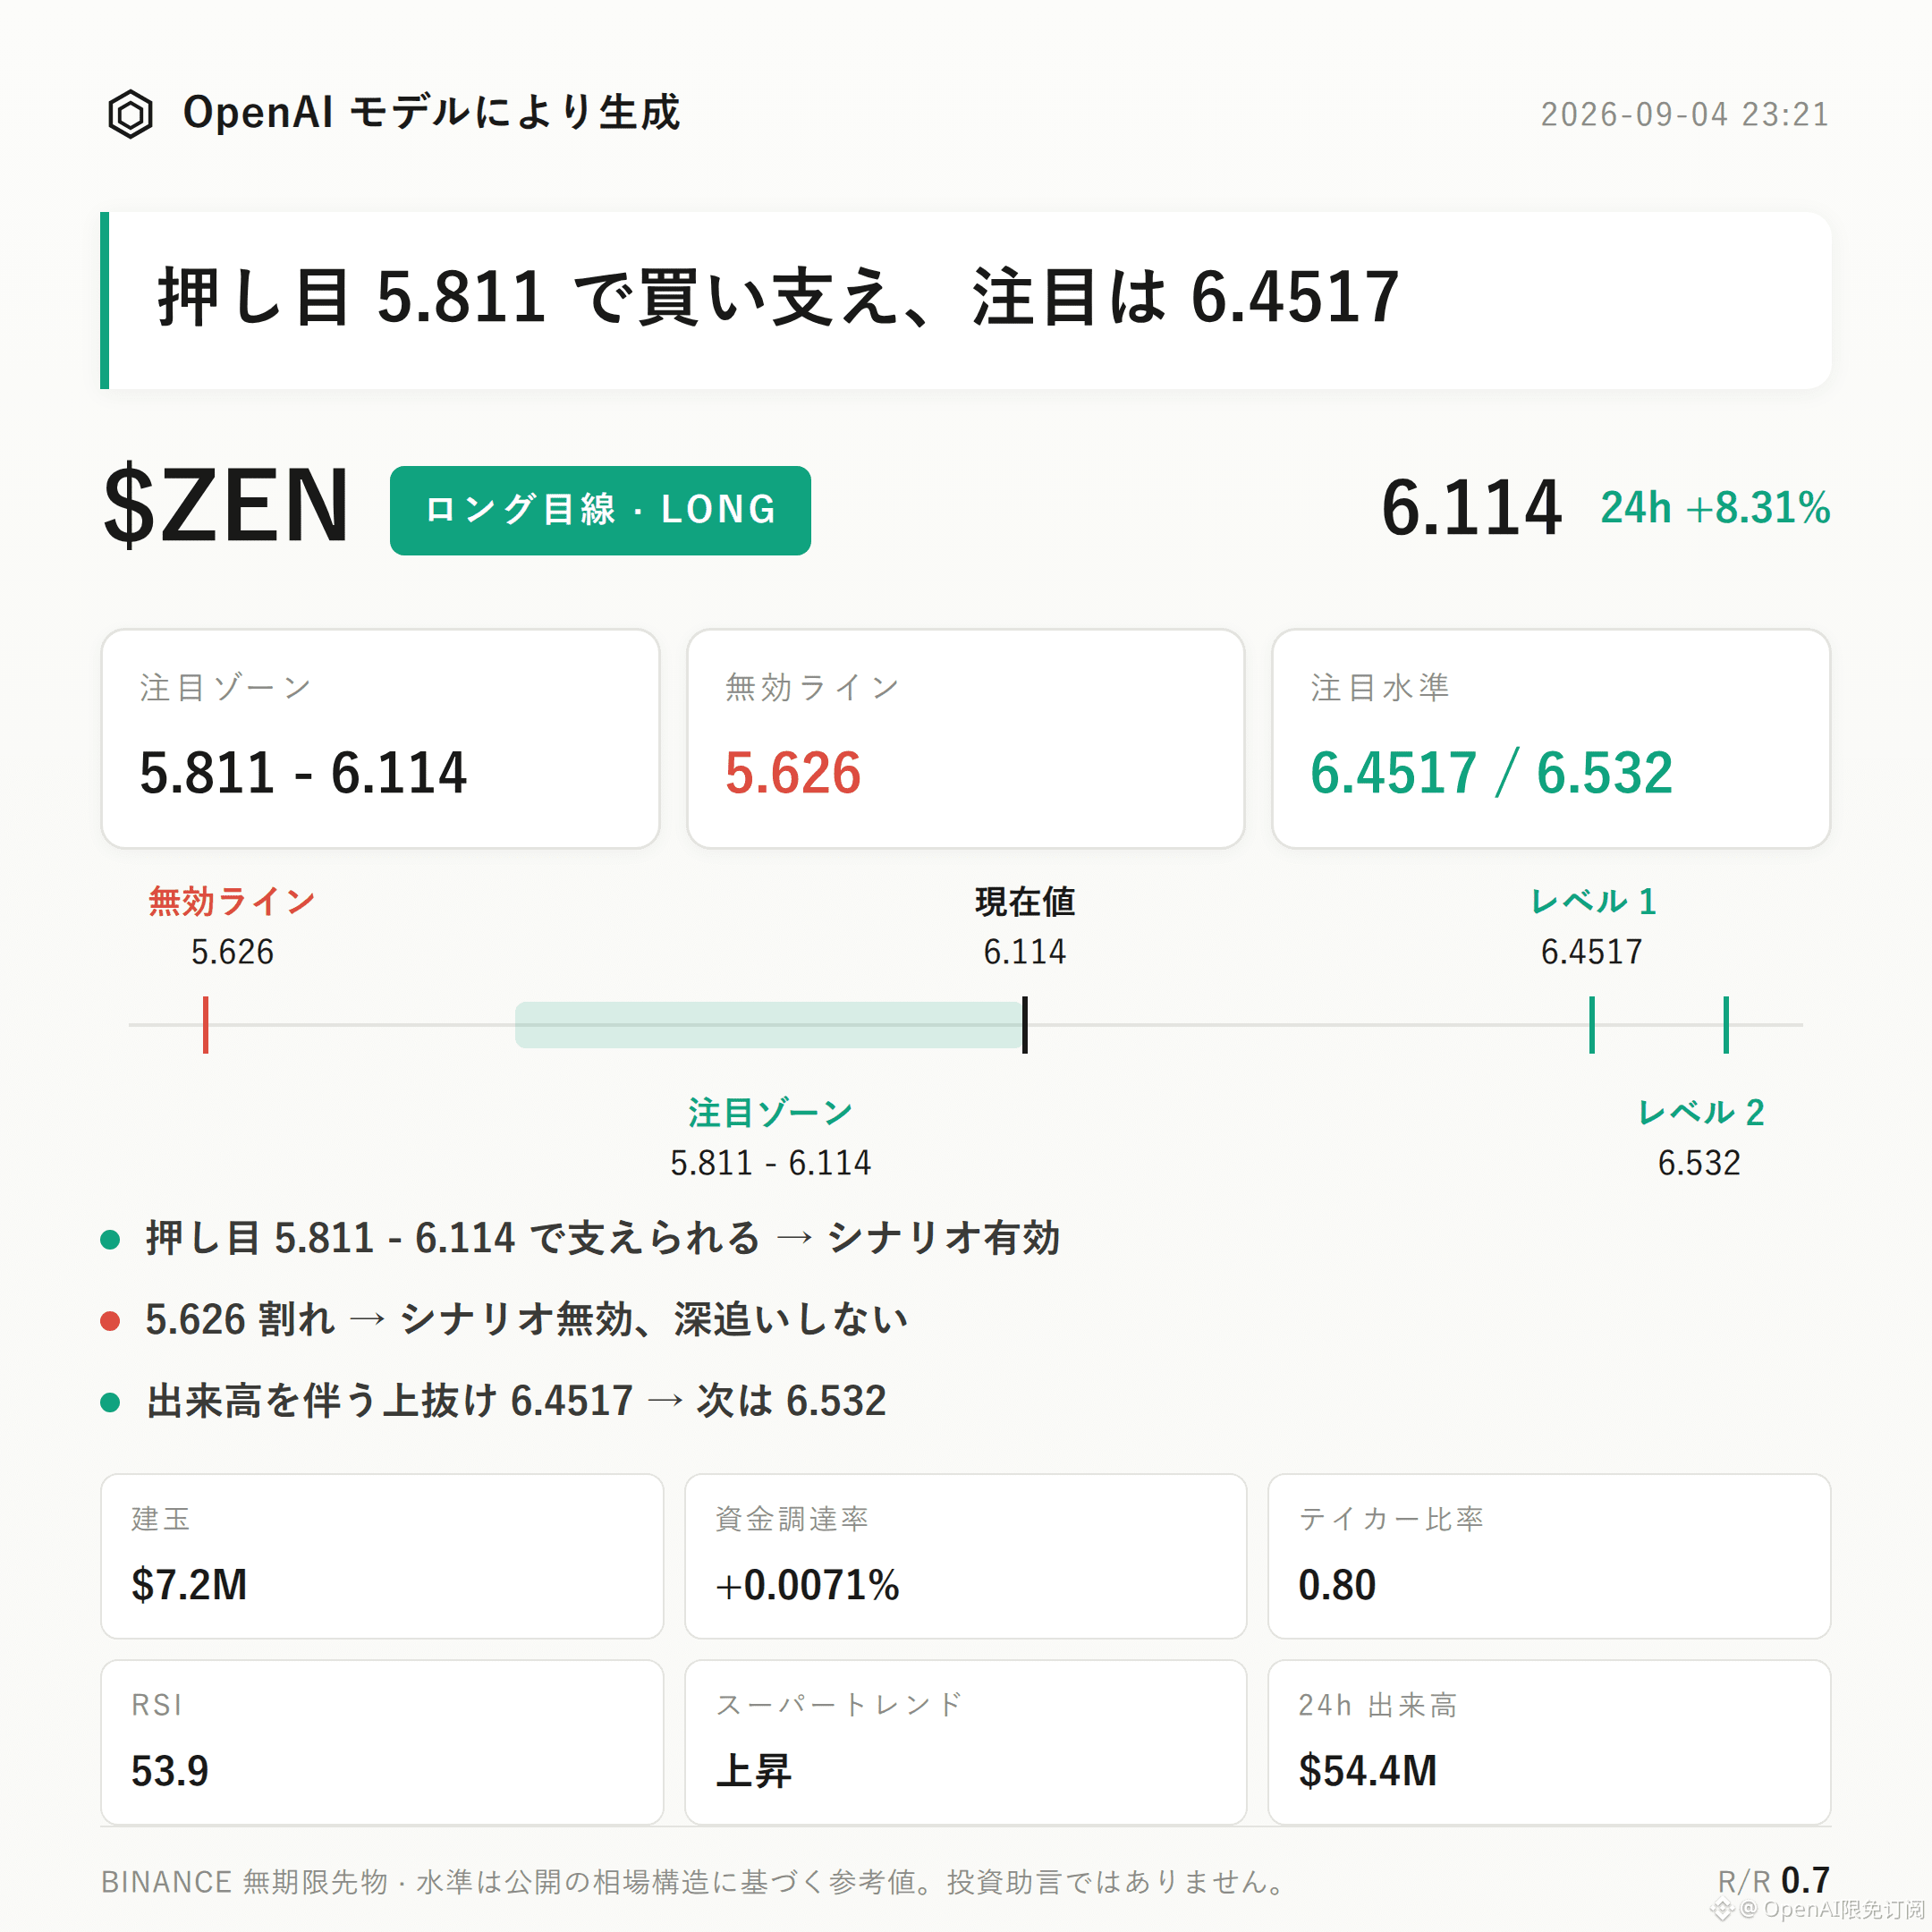
$ZEN bullish bias | Focus area 5.811 - 6.114 | Invalidation reference 5.626 | Watch levels 6.4517 / 6.532
$ZEN is currently in a bullish structure.
Supertrend remains upward, MACD shows bullish momentum, and open interest has increased by 7.7% over 24 hours, which are the three strongest supporting signals for this move.
The key is whether the bullish reference zone can continue to attract support, as this is the decisive factor for whether the structure extends.
From a technical perspective, $ZEN is currently priced at 6.114, positioned in the upper part of the range between the recent low of 5.626 and the recent high of 6.532.
The Bollinger middle band is 6.1314, and the current price is running close to it. The upper band at 6.4517 and lower band at 5.811 define the short-term volatility boundary.
RSI is 53.9, in a neutral-to-healthy range and not yet overbought, leaving room for further upside.
The Supertrend direction is upward, and MACD is showing bullish momentum; together with the 24-hour +8.31% trend-following performance, they point in the same direction.
On the derivatives data side, 24-hour trading volume is 54.42 million USD, open interest is 7.16 million USD, and it has increased by 7.7% over 24 hours, indicating that new positions are rising in sync with price.
The funding rate is +0.0071%, which is low, so the cost of holding long positions is still not high.
The long/short account ratio shows 64% long accounts, indicating a bullish account structure.
However, it must be stated honestly that the active buy/sell ratio is 0.80, meaning active selling pressure has not been overwhelmed by bullish buying. This suggests that the current push higher relies more on passive bid support than on aggressive market buying, which is a signal contrary to the bullish structure and should not be ignored.
As for reference levels, bulls should first watch the 5.811 to 6.114 zone. It is more appropriate to wait for the price to retrace into this area and then look for signs of support before making a further judgment, rather than assuming the trend will continue directly at higher levels.
If a retracement into the focus area is supported, the bullish idea can be considered valid; if the price falls below 5.626, it means the current upward structure has been broken and the bullish idea should be considered invalid, and the original bias should no longer be applied.
If price breaks above 6.4517 with volume and continues, then 6.532 can be watched as a reference for the next resistance and potential extension.
It should be noted that the current reference risk/reward ratio is 0.7, which is not favorable in terms of risk versus potential upside. Combined with the fact that the active buy/sell ratio is not on the bulls’ side, the structure is bullish but confirmation is limited, so one should not assume that a breakout will necessarily be realized.
Under leveraged contracts, position discipline matters more than directional judgment.
Live disclosure: this account currently holds a $FOGO long position. The structure remains bullish, and the view matches the position.
For reference only, not investment advice. Contracts involve leverage, and investing carries risk.
This article was generated with assistance from an OpenAI large model.
$ZEN
#ContractAnalysis
$ZEN bullish bias | Focus area 5.811 - 6.114 | Invalidation reference 5.626 | Watch levels 6.4517 / 6.532
$ZEN is currently in a bullish structure.
Supertrend remains upward, MACD shows bullish momentum, and open interest has increased by 7.7% over 24 hours, which are the three strongest supporting signals for this move.
The key is whether the bullish reference zone can continue to attract support, as this is the decisive factor for whether the structure extends.
From a technical perspective, $ZEN is currently priced at 6.114, positioned in the upper part of the range between the recent low of 5.626 and the recent high of 6.532.
The Bollinger middle band is 6.1314, and the current price is running close to it. The upper band at 6.4517 and lower band at 5.811 define the short-term volatility boundary.
RSI is 53.9, in a neutral-to-healthy range and not yet overbought, leaving room for further upside.
The Supertrend direction is upward, and MACD is showing bullish momentum; together with the 24-hour +8.31% trend-following performance, they point in the same direction.
On the derivatives data side, 24-hour trading volume is 54.42 million USD, open interest is 7.16 million USD, and it has increased by 7.7% over 24 hours, indicating that new positions are rising in sync with price.
The funding rate is +0.0071%, which is low, so the cost of holding long positions is still not high.
The long/short account ratio shows 64% long accounts, indicating a bullish account structure.
However, it must be stated honestly that the active buy/sell ratio is 0.80, meaning active selling pressure has not been overwhelmed by bullish buying. This suggests that the current push higher relies more on passive bid support than on aggressive market buying, which is a signal contrary to the bullish structure and should not be ignored.
As for reference levels, bulls should first watch the 5.811 to 6.114 zone. It is more appropriate to wait for the price to retrace into this area and then look for signs of support before making a further judgment, rather than assuming the trend will continue directly at higher levels.
If a retracement into the focus area is supported, the bullish idea can be considered valid; if the price falls below 5.626, it means the current upward structure has been broken and the bullish idea should be considered invalid, and the original bias should no longer be applied.
If price breaks above 6.4517 with volume and continues, then 6.532 can be watched as a reference for the next resistance and potential extension.
It should be noted that the current reference risk/reward ratio is 0.7, which is not favorable in terms of risk versus potential upside. Combined with the fact that the active buy/sell ratio is not on the bulls’ side, the structure is bullish but confirmation is limited, so one should not assume that a breakout will necessarily be realized.
Under leveraged contracts, position discipline matters more than directional judgment.
Live disclosure: this account currently holds a $FOGO long position. The structure remains bullish, and the view matches the position.
For reference only, not investment advice. Contracts involve leverage, and investing carries risk.
This article was generated with assistance from an OpenAI large model.
$ZEN
#ContractAnalysis