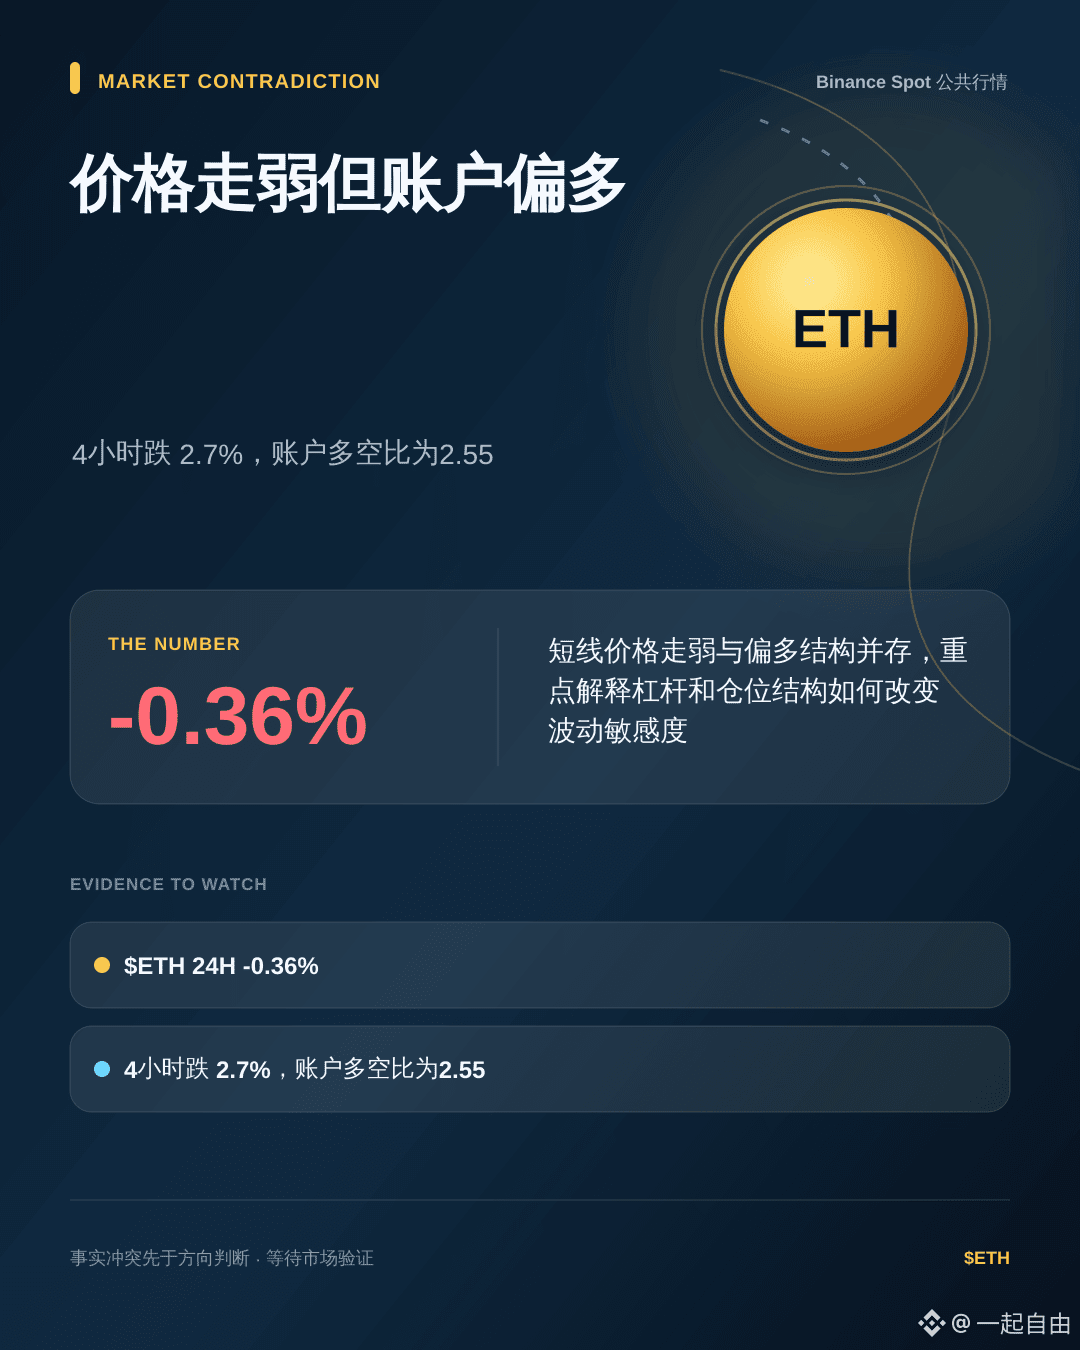
From a 1-hour rise of 0.0% to a 4-hour drop of 2.7%, the price action shows a contrast. Is the predominantly long positioning under pressure?
As of 22:42, $ETH is at 2448 USDT, down 0.4% over the past 24 hours.
The 1-hour move is up 0.0%.
The funding rate is +0.0020%, meaning longs are currently paying shorts.
The 4-hour move is down 2.7%, while open interest has decreased 2.3% over 4 hours, suggesting leverage is contracting and reverse price swings may be more sensitive.
The 4-hour move is down 2.7%, but the long/short account ratio is 2.55, which suggests a weakening price coexisting with a long-biased account structure; direction should not be judged by a single indicator alone.
In my view, the 4-hour drop of 2.7% همراه with trading volume expanding to 2.40 times looks more like rising activity during this weakening phase, and short-term volatility may become more sensitive.
If the 15-minute close falls below 2451, it will support the current bearish interpretation.
If the 15-minute close rises above 2527, it will overturn the current bearish interpretation.
Would you be more inclined to view this as deleveraging, or as a long-biased structure under pressure?
$ETH #以太坊 #long-short data
As of 22:42, $ETH is at 2448 USDT, down 0.4% over the past 24 hours.
The 1-hour move is up 0.0%.
The funding rate is +0.0020%, meaning longs are currently paying shorts.
The 4-hour move is down 2.7%, while open interest has decreased 2.3% over 4 hours, suggesting leverage is contracting and reverse price swings may be more sensitive.
The 4-hour move is down 2.7%, but the long/short account ratio is 2.55, which suggests a weakening price coexisting with a long-biased account structure; direction should not be judged by a single indicator alone.
In my view, the 4-hour drop of 2.7% همراه with trading volume expanding to 2.40 times looks more like rising activity during this weakening phase, and short-term volatility may become more sensitive.
If the 15-minute close falls below 2451, it will support the current bearish interpretation.
If the 15-minute close rises above 2527, it will overturn the current bearish interpretation.
Would you be more inclined to view this as deleveraging, or as a long-biased structure under pressure?
$ETH #以太坊 #long-short data