Trading idea | 9/4 22:21
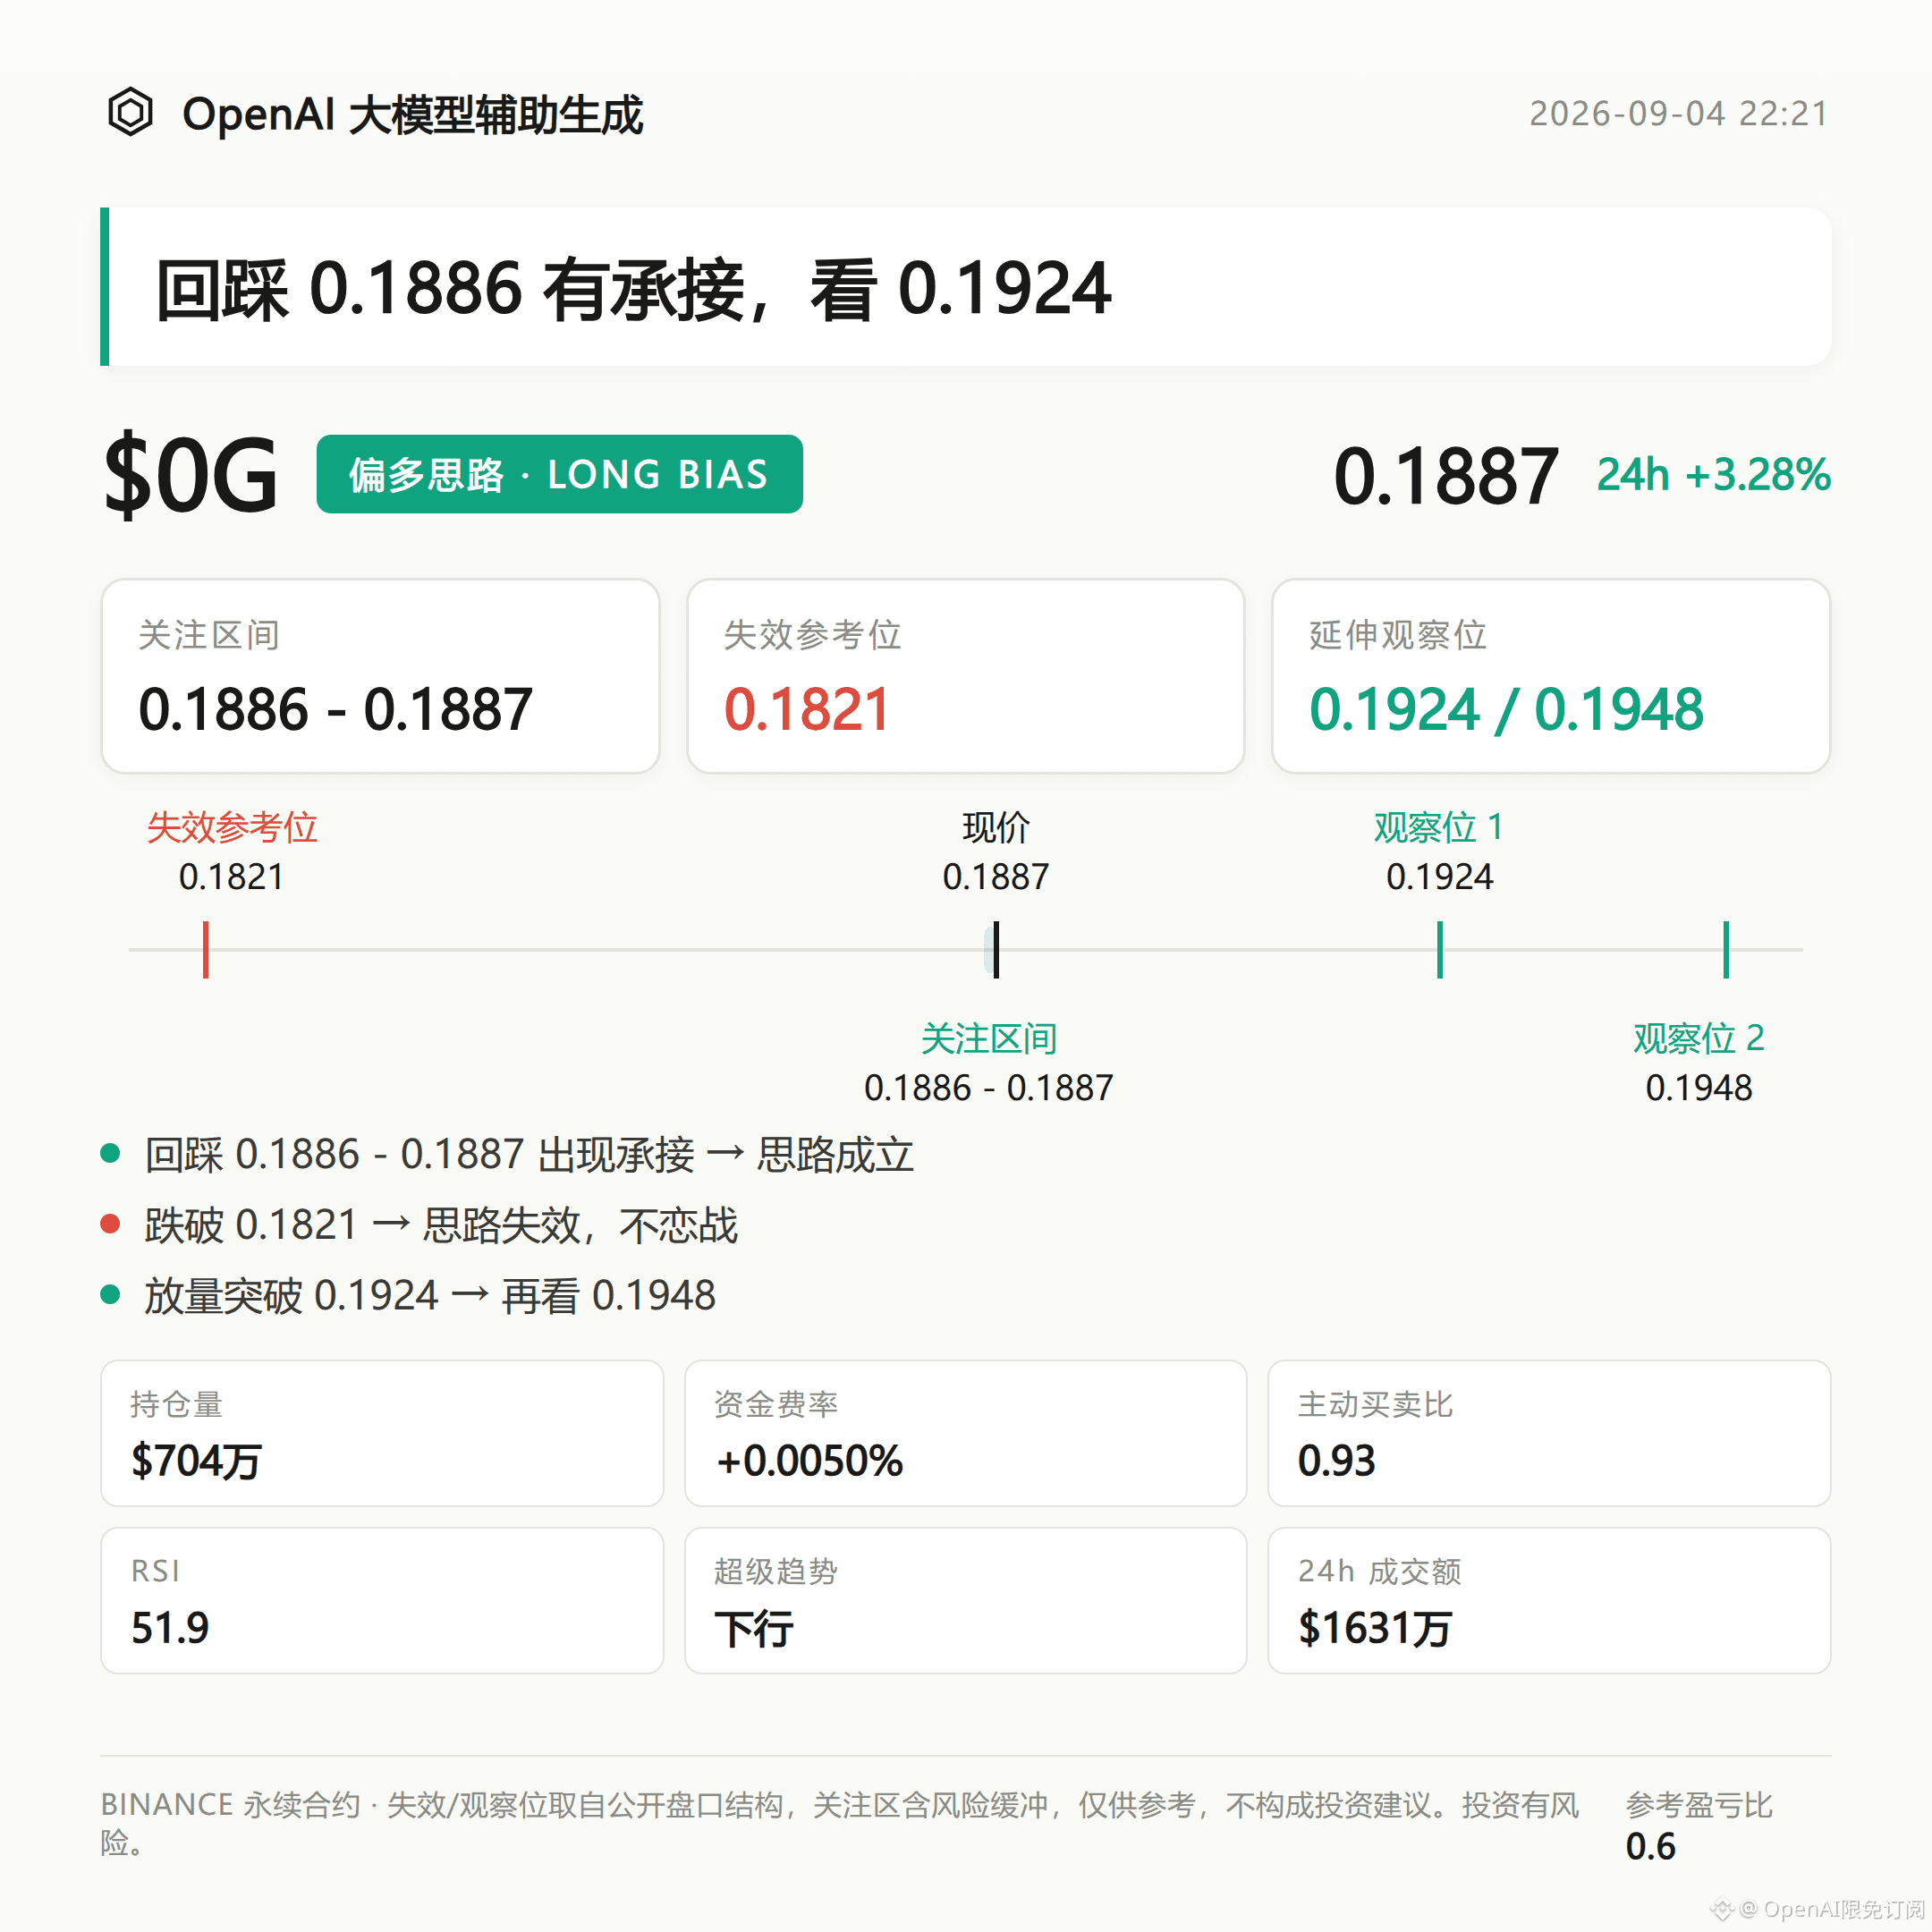
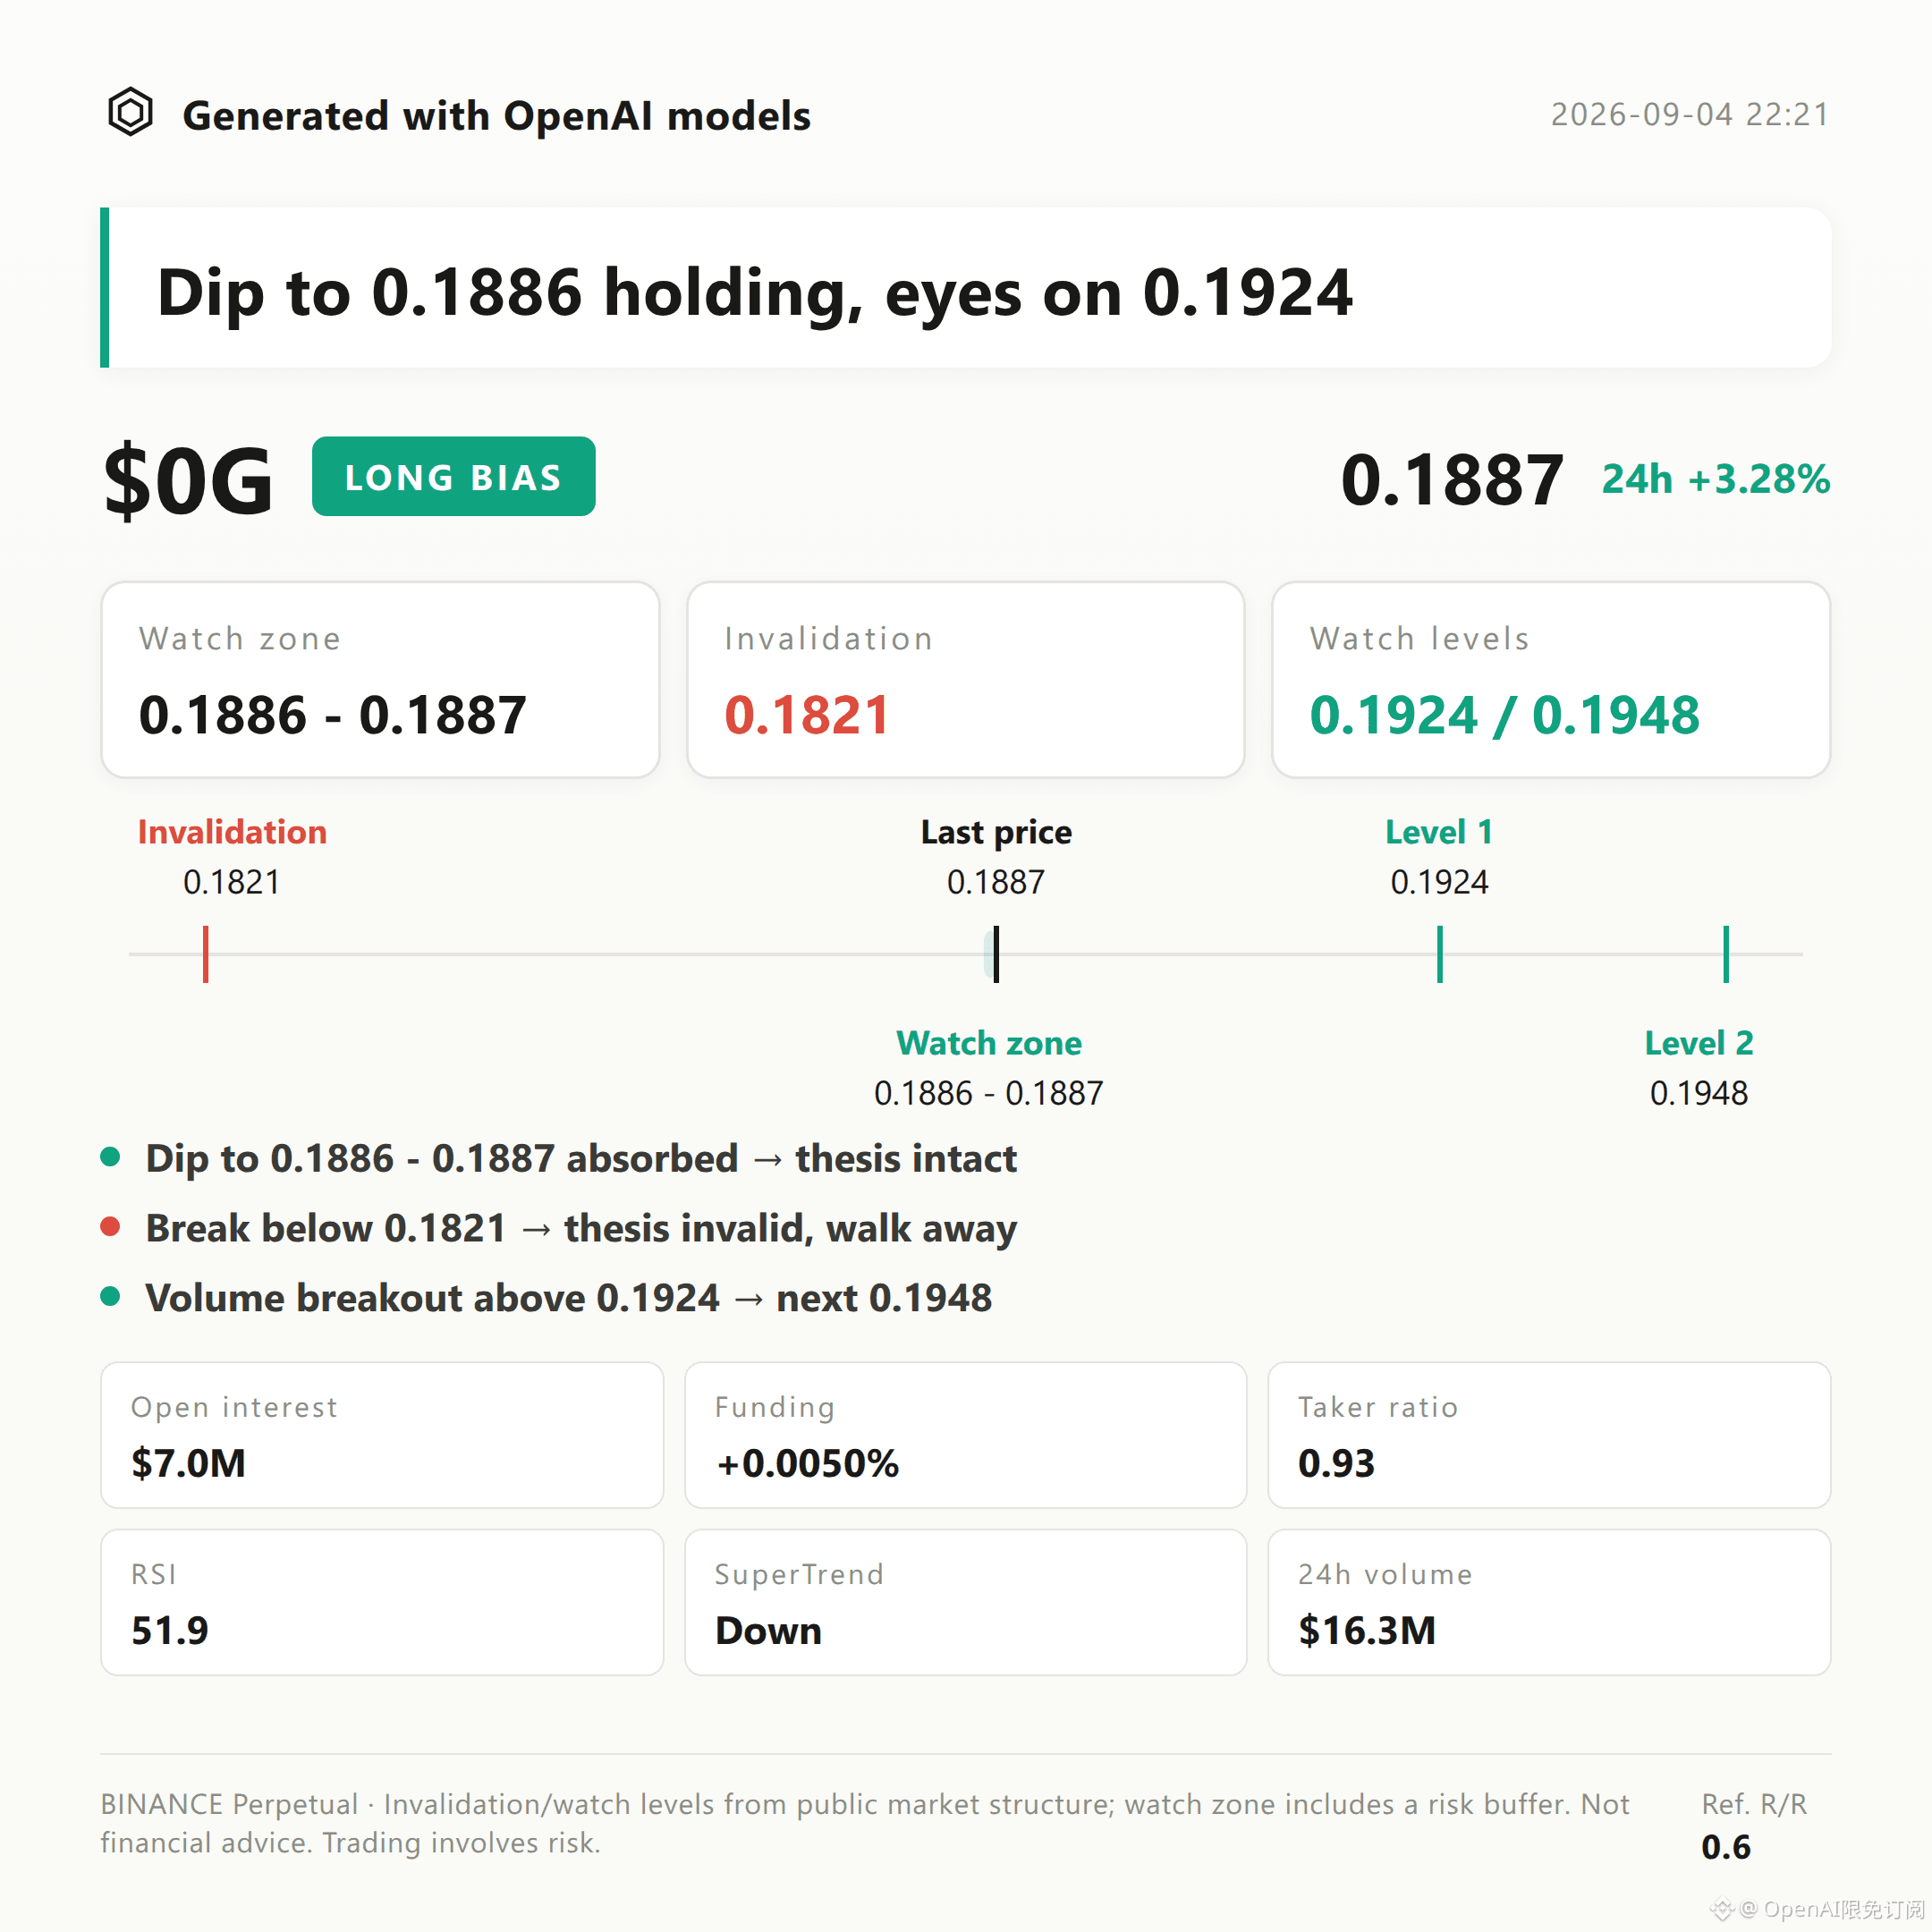
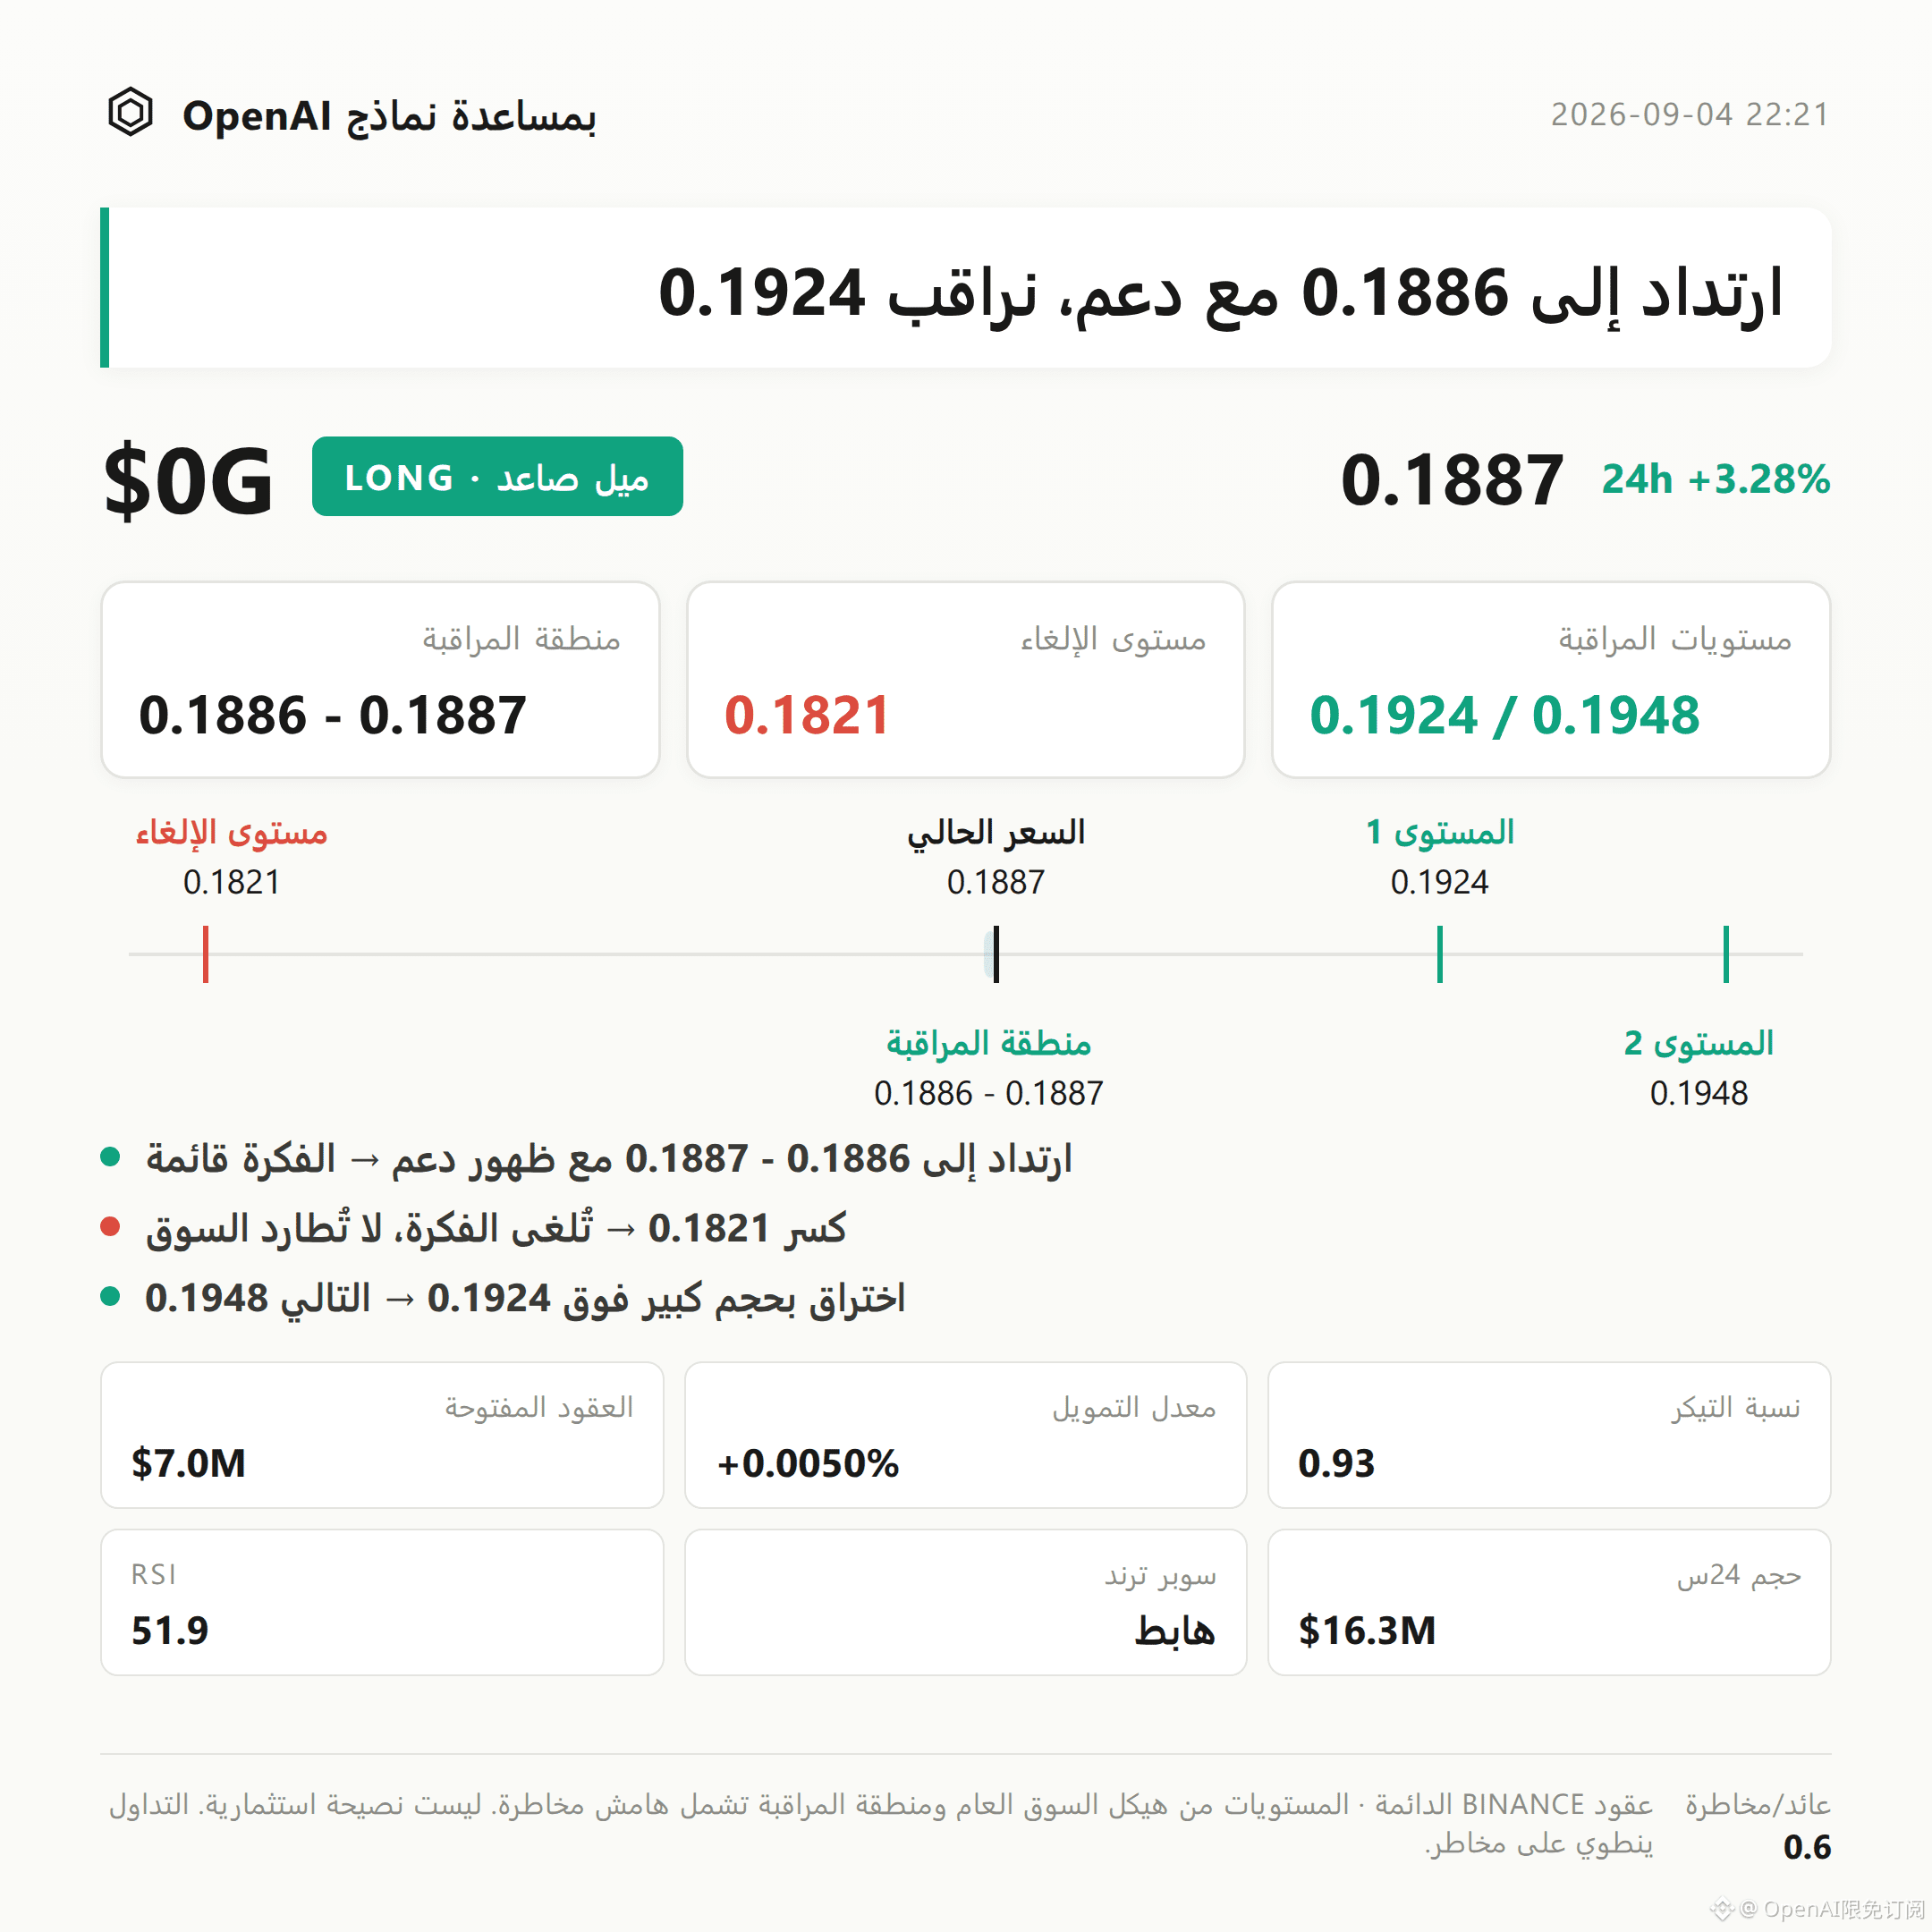
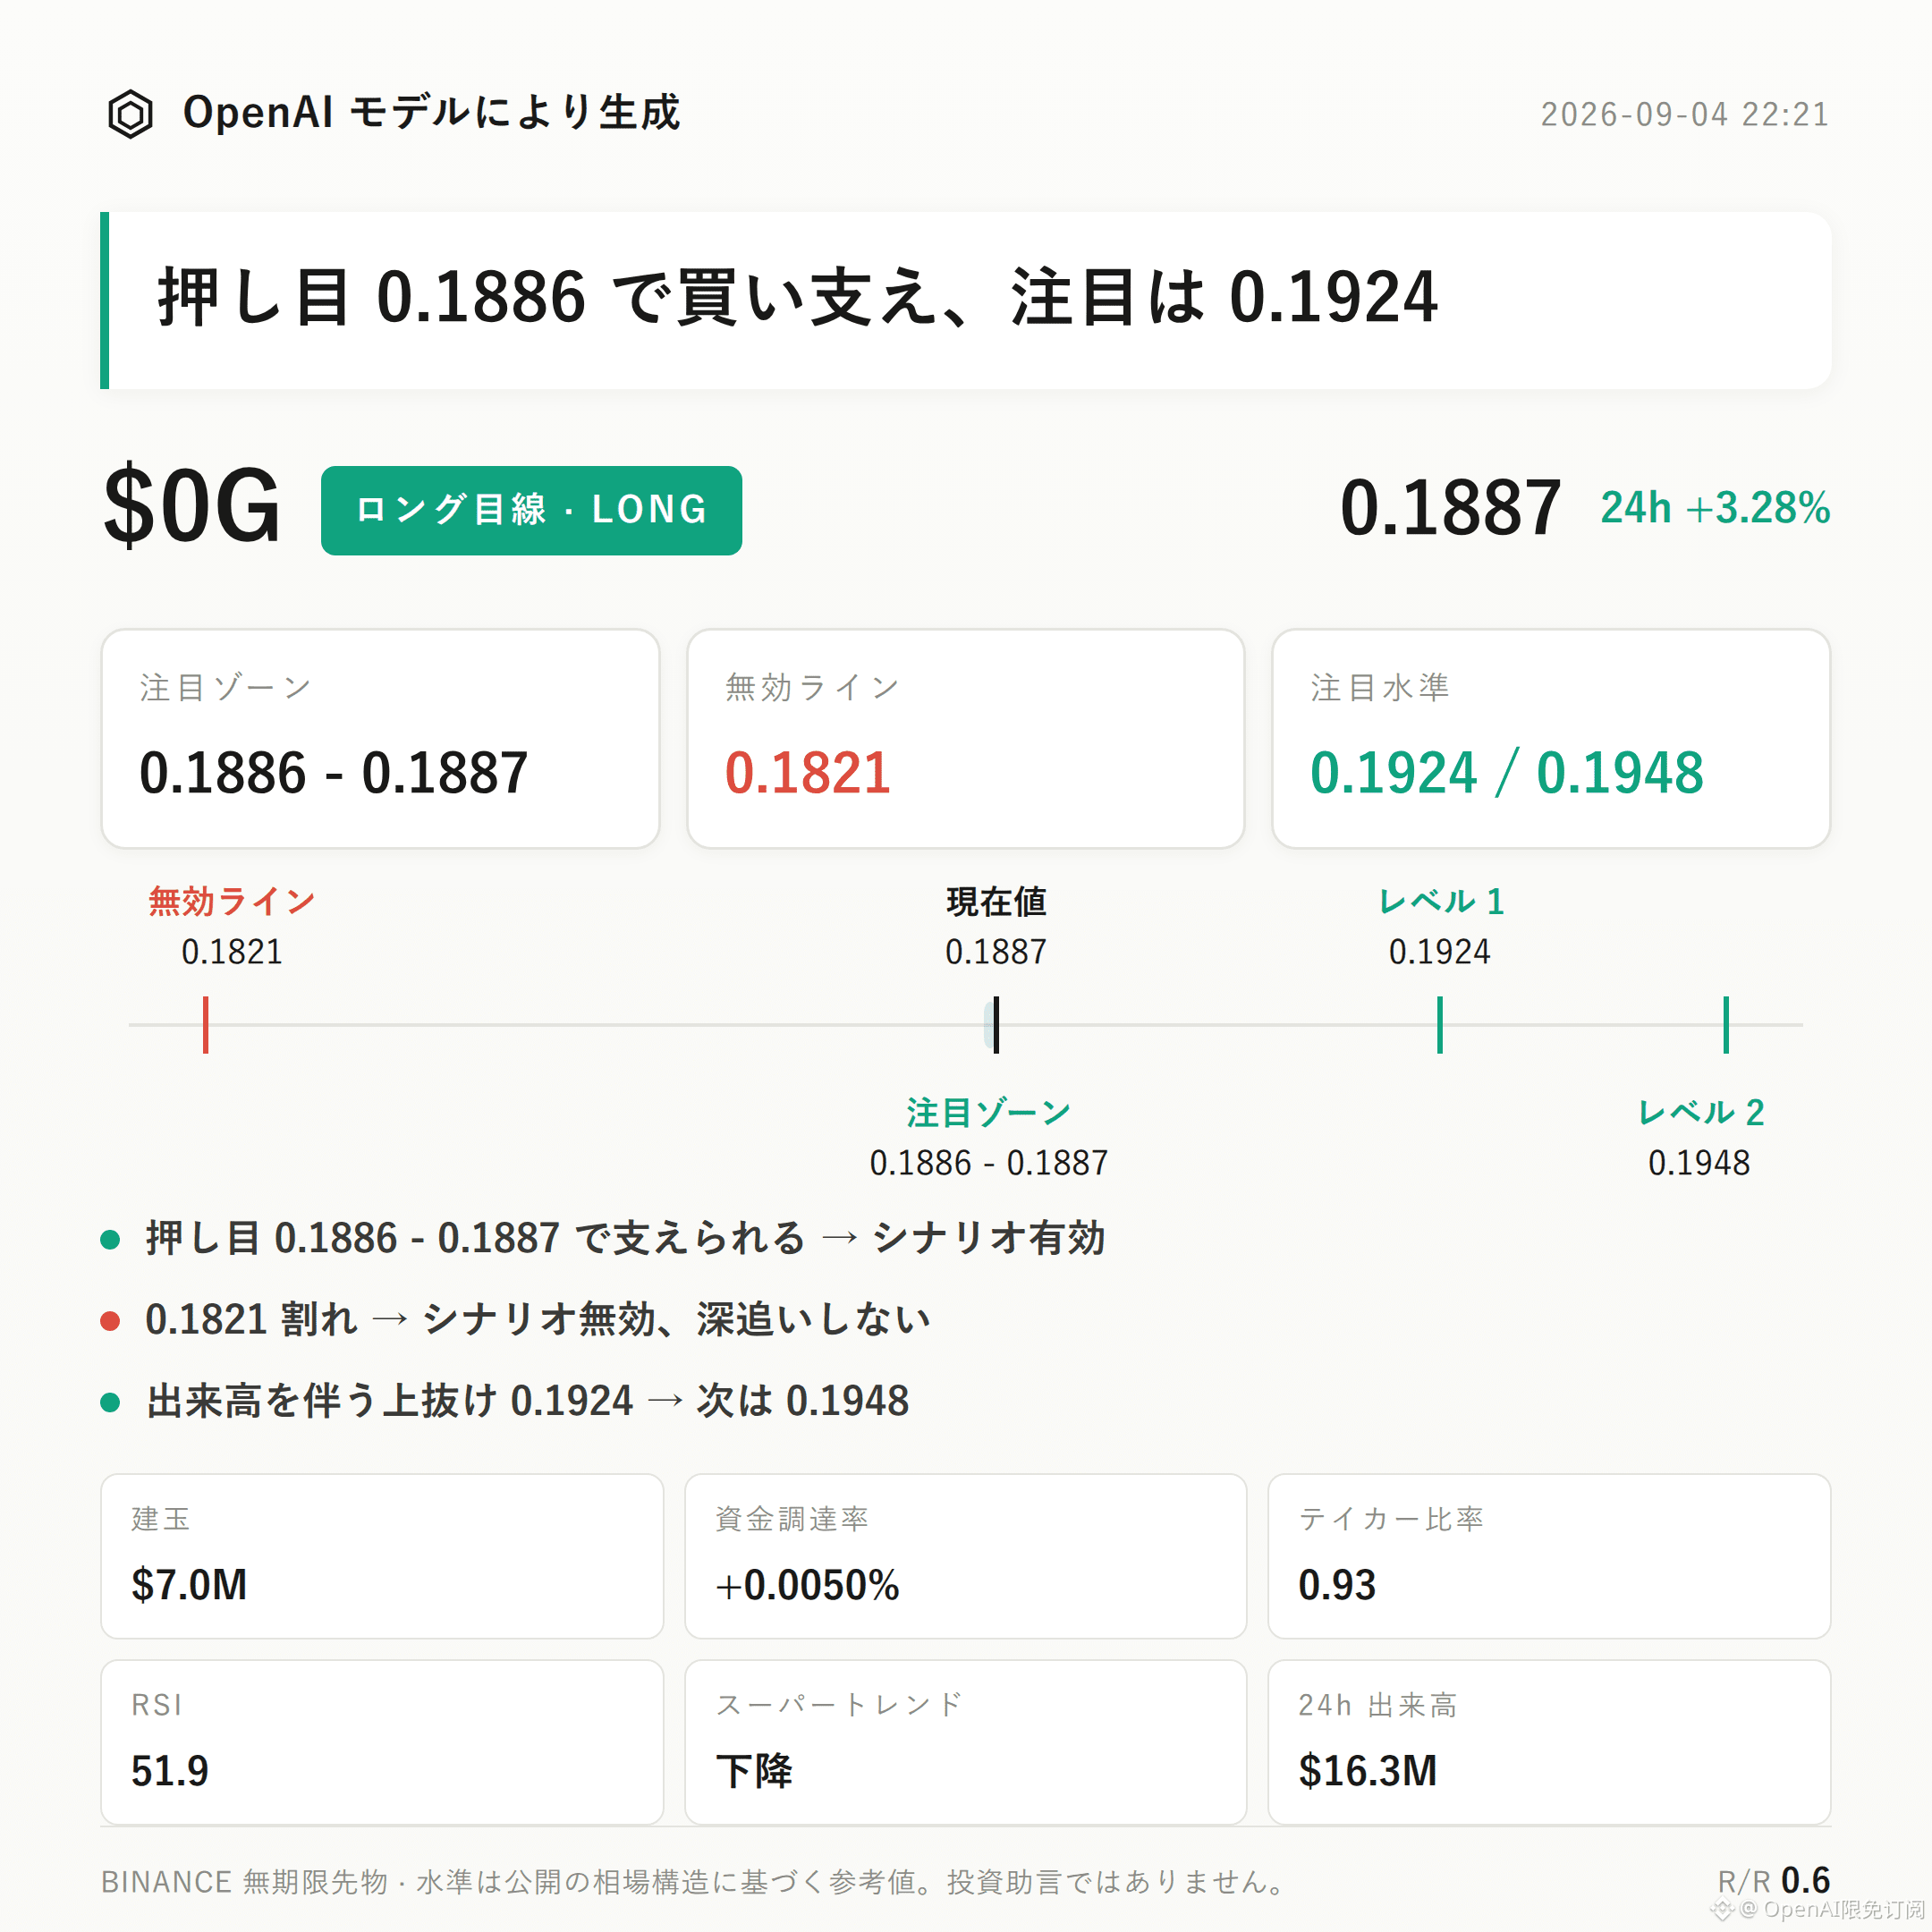
$0G bullish bias | Focus zone 0.1886 - 0.1887 | Invalidation reference 0.1821 | Watch levels 0.1924 / 0.1948
$0G is currently forming a bullish structure.
The core argument comes from three points: MACD is maintaining bullish momentum, RSI is at a healthy 51.9 level with no sign of being overbought, and the 24-hour price has risen 3.28% in line with the trend.
Going forward, the key is to see whether the bullish focus zone can find support on a pullback, thereby confirming whether the structure continues.
From a technical structure perspective, the recent high is 0.1948, the recent low is 0.1821, and the price is currently operating in the upper half of the range.
Bollinger Bands show the upper band at 0.1924, the middle band at 0.1886, and the lower band at 0.1848. The current price of 0.1887 is close to the middle band, and there is not yet a clear upward breakout space.
It should be noted that the Supertrend indicator currently shows a downward trend, which is inconsistent with the bullish momentum direction indicated by MACD; the two signals are diverging.
In derivatives data, 24-hour trading volume is about 16.31 million USD, open interest is about 7.04 million USD, and the 24-hour open interest change is -6.7%.
Price is rising while open interest is shrinking, which looks more like short covering than new bullish capital inflow, so caution is needed.
The funding rate is +0.0050%, which is at a low level, so the pressure on leveraged longs from funding costs is not significant.
Long accounts account for 43%, and on an account-count basis bears still hold the majority.
The taker buy/sell ratio is 0.93, with taker sell pressure slightly stronger, and buyers have not yet gained clear dominance.
Reference levels: if the bullish focus zone at 0.1886-0.1887 shows signs of support after a pullback, the bullish idea can continue to be monitored.
If the price falls below the invalidation level at 0.1821, it means the upward structure has been damaged, the bullish idea fails, and it should no longer be viewed under the original thesis.
If the price breaks above the watch level at 0.1924 with volume, then attention can shift to the resistance around 0.1948, and continuation will need volume confirmation.
It should be stated honestly that there are many contrary signals in this dataset: the taker buy/sell ratio of 0.93 shows buyers are not dominant, the Supertrend remains downward, 24-hour open interest contracted by 6.7%, and the share of long accounts is below half; all of these conflict with the bullish bias.
The reference risk-reward ratio is only 0.6, so the risk-return structure is not favorable, and caution is needed when evaluating it.
Under leveraged contracts, position discipline matters more than directional judgment.
Position note: this account currently holds a live long position of $FOGO , and it will continue to be held as long as the logic remains intact.
For reference only, not investment advice. Contracts involve leverage, and investing carries risk.
This article was generated with the assistance of an OpenAI large model.
$0G
#contractanalysis
$0G bullish bias | Focus zone 0.1886 - 0.1887 | Invalidation reference 0.1821 | Watch levels 0.1924 / 0.1948
$0G is currently forming a bullish structure.
The core argument comes from three points: MACD is maintaining bullish momentum, RSI is at a healthy 51.9 level with no sign of being overbought, and the 24-hour price has risen 3.28% in line with the trend.
Going forward, the key is to see whether the bullish focus zone can find support on a pullback, thereby confirming whether the structure continues.
From a technical structure perspective, the recent high is 0.1948, the recent low is 0.1821, and the price is currently operating in the upper half of the range.
Bollinger Bands show the upper band at 0.1924, the middle band at 0.1886, and the lower band at 0.1848. The current price of 0.1887 is close to the middle band, and there is not yet a clear upward breakout space.
It should be noted that the Supertrend indicator currently shows a downward trend, which is inconsistent with the bullish momentum direction indicated by MACD; the two signals are diverging.
In derivatives data, 24-hour trading volume is about 16.31 million USD, open interest is about 7.04 million USD, and the 24-hour open interest change is -6.7%.
Price is rising while open interest is shrinking, which looks more like short covering than new bullish capital inflow, so caution is needed.
The funding rate is +0.0050%, which is at a low level, so the pressure on leveraged longs from funding costs is not significant.
Long accounts account for 43%, and on an account-count basis bears still hold the majority.
The taker buy/sell ratio is 0.93, with taker sell pressure slightly stronger, and buyers have not yet gained clear dominance.
Reference levels: if the bullish focus zone at 0.1886-0.1887 shows signs of support after a pullback, the bullish idea can continue to be monitored.
If the price falls below the invalidation level at 0.1821, it means the upward structure has been damaged, the bullish idea fails, and it should no longer be viewed under the original thesis.
If the price breaks above the watch level at 0.1924 with volume, then attention can shift to the resistance around 0.1948, and continuation will need volume confirmation.
It should be stated honestly that there are many contrary signals in this dataset: the taker buy/sell ratio of 0.93 shows buyers are not dominant, the Supertrend remains downward, 24-hour open interest contracted by 6.7%, and the share of long accounts is below half; all of these conflict with the bullish bias.
The reference risk-reward ratio is only 0.6, so the risk-return structure is not favorable, and caution is needed when evaluating it.
Under leveraged contracts, position discipline matters more than directional judgment.
Position note: this account currently holds a live long position of $FOGO , and it will continue to be held as long as the logic remains intact.
For reference only, not investment advice. Contracts involve leverage, and investing carries risk.
This article was generated with the assistance of an OpenAI large model.
$0G
#contractanalysis