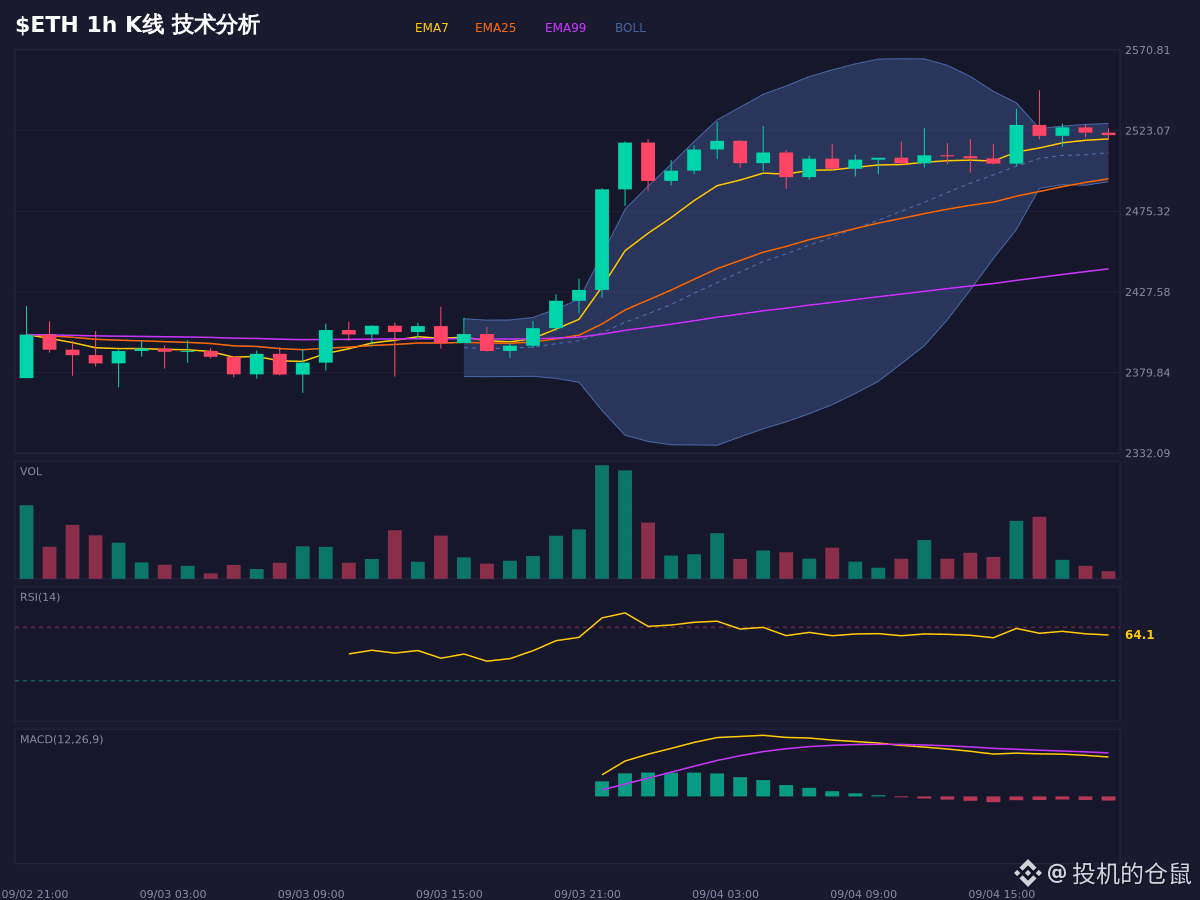
I had just taken a bite of takeout and came across this $ETH . The chart looks interesting, and it made me laugh.
It is trading above the middle line of the Bollinger Bands, but bearish divergence and OBV capital outflow form a clear contradictory signal. Price has made a new high but RSI has not kept up, which is a classic sign of bullish exhaustion.
If it holds above the 2527.29 upper band, the bullish structure will continue; if it falls below the 2510.07 middle band, the current logic will fail.
This is only for chart observation and conditional scenario analysis, and does not constitute a trading record.
$ETH #行情分析 #合约 #bull market
It is trading above the middle line of the Bollinger Bands, but bearish divergence and OBV capital outflow form a clear contradictory signal. Price has made a new high but RSI has not kept up, which is a classic sign of bullish exhaustion.
If it holds above the 2527.29 upper band, the bullish structure will continue; if it falls below the 2510.07 middle band, the current logic will fail.
This is only for chart observation and conditional scenario analysis, and does not constitute a trading record.
$ETH #行情分析 #合约 #bull market