
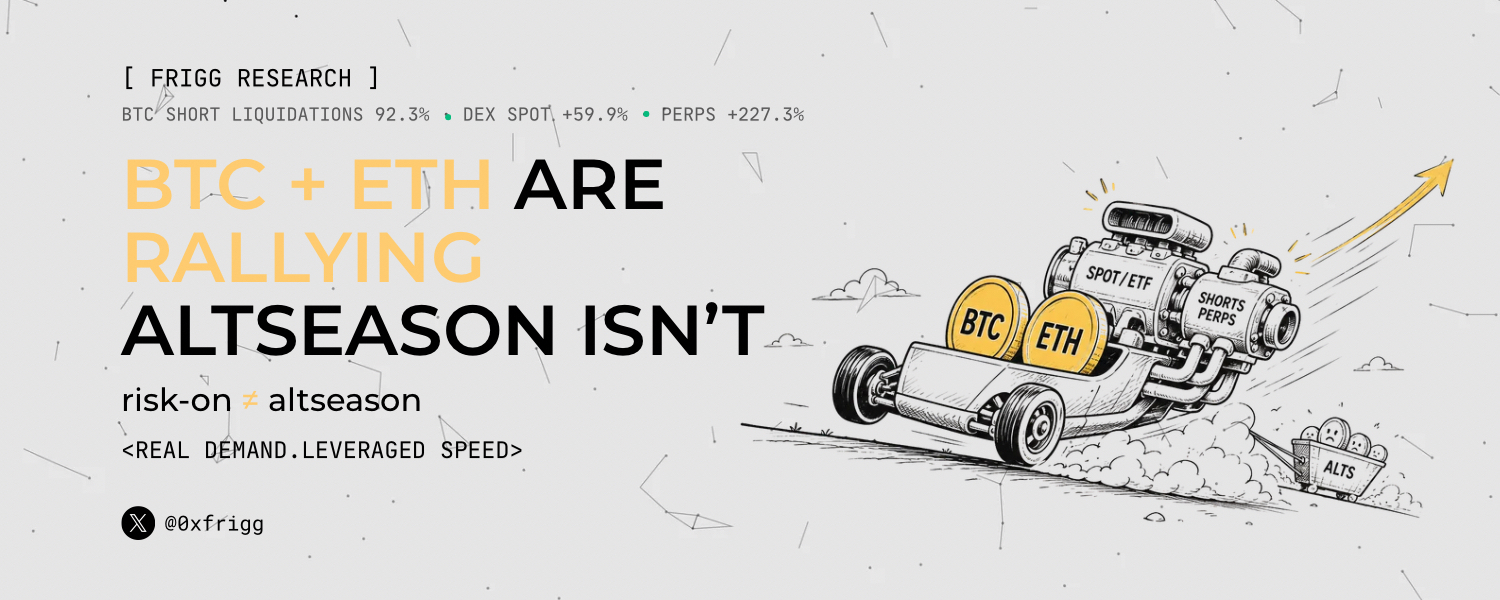


There was real demand underneath the move in BTC and ETH. Strong net inflows into US spot ETFs and rising trading volume already support this.
But the speed of the move got bigger because of leverage. As traders who opened shorts got liquidated they were forced to buy back
Even with that there is no altseason.
Money is concentrating in BTC ETH and other major assets. The broader altcoin basket is still not outperforming BTC.
So this is not only an ETH story, not only a short squeeze and not an “altcoin season started” situation either.
This is a major-focused, selective risk-on regime that is also sensitive to leverage.
There are two different engines in the market
Our main engine is new money coming into ETFs and spot buying interest. This creates the real demand base needed for price to move higher.
Then there is another factor accelerating this main engine. Short liquidations and perp trading. This makes the same move much faster and much more aggressive.
So you can think about ETFs and spot demand as the engine of the car. The short squeeze works like the turbo.
There is one important note I want to add here. Moves driven only by the turbo can start fast but can also fade fast. Moves driven only by spot buying are usually calmer but more sustainable. In this rally we have both. So the structure is positive but volatility risk is high.
How obvious was the short squeeze in this rally?
24 hour liquidation data shows:
Total liquidations: $265.9M
Short liquidations: $245.3M
Long liquidations: $20.6M
Short share: 92.3%
Total liquidations: $102.4M
Short liquidations: $81.2M
Long liquidations: $21.1M
Short share: 79.4%
Total liquidations: $14.1M
Short liquidations: $11.7M
Long liquidations: $2.4M
Short share: 83.0%
The biggest part of BTC’s $245.3M short liquidations happened on Binance, Hyperliquid and Bybit
Binance: $98.5M
Hyperliquid: $60.8M
Bybit: $30.1M
This data already gives a very clear yes to the question of whether a short squeeze happened.
So was this just a leverage-inflated rally?
No because spot activity increased too.
Spot volume on on-chain DEXs increased around 59.9% over the last 24 hours. This shows trading activity expanded not only in futures but also on the spot side.
But on-chain perp volume increased around 227.3%. This difference is very important.
DEX spot volume 24h change: +59.9%. Real buying and selling interest increased.
On-chain perp volume 24h change: +227.3%. Leveraged trading activity accelerated much harder.
What does funding tell us? Why should we be a bit more careful with ETH?
In the perp market there is a regular payment between long and short positions. This is called funding as you already know.
If funding is positive, longs pay shorts.
If funding is negative, shorts pay longs.
Positive funding usually shows the market wants to take more upside exposure. But if funding gets too high, too many longs may be crowded into the market and downside liquidation risk can build.
The current picture looks like this:
OI-weighted funding: 0.005175
Intraday peak: 0.007136
Positive but below the peak
OI-weighted funding: 0.007036
Intraday peak: 0.009598
Higher than BTC; ETH longs are relatively more expensive to carry
The good part here is funding already pulled back from its intraday highs. So the market is not clearly in the “everyone is max leveraged long” phase yet.
The risk is more visible on ETH.
ETH funding is higher than BTC. This shows stronger demand for long positioning in ETH and also means ETH longs can be more sensitive if price drops quickly.
What does “narrow risk-on” mean? Why is this not altcoin season?
Risk-on means an environment where investors are willing to buy riskier assets. In crypto this can mean BTC, ETH, SOL or smaller tokens moving higher.
But risk-on does not always spread across the whole market.
Right now:
BTC is strong
ETH is strong
SOL is reacting in the short term
But a large number of altcoins are still not outperforming BTC
The Altcoin Season Index is used for this. It measures whether a selected group of major altcoins outperformed BTC over the last 90 days.
The index was 45 one month ago, today it is 38. One week ago it was 33. So there is a small recovery but still no broad altcoin leadership.
The logical timeline of what happened from start to finish
Phase 1 — The demand base formed
At the end of August BTC and ETH ETFs were already seeing meaningful inflows. On September 3 BTC ETFs saw +$730.8Mwhile ETH ETFs saw +$141.4M.
This showed that larger and more traditional investors still wanted BTC/ETH exposure.
Phase 2 — Price accelerated higher
BTC moved from the $77K area to above $80K. ETH moved from around $2.39K to above $2.5K.
Spot trading volume expanded during this phase too. So the move does not look like something created only by a thin market or a few leveraged orders.
Phase 3 — Shorts got squeezed
As price moved higher, traders betting on downside started taking losses. Once collateral became insufficient positions were liquidated. In BTC, 92.3% of liquidations were shorts.
These forced position closures created additional buying and accelerated the move even more.
Phase 4 — New longs entered and funding stayed positive
Some traders saw the rally and opened upside positions too. We can see this from funding staying positive.
But funding cooled from its intraday peak.
For now this points more toward a market that is rebalancing after the rally but still sensitive to the long side, instead of full euphoria.
Phase 5 — Money did not spread broadly into altcoins
Altcoin Season Index is only 38.
So the rally stayed centered around BTC/ETH. Some larger assets like SOL reacted too but broad market leadership did not appear.
This defines the regime like this:
A selective risk-taking environment led by majors with ETF access.
What scenarios are possible from here?
Bullish scenario: “Spot-led continuation”
In this scenario ETF inflows continue, BTC/ETH prices hold and funding does not overheat.
What would we need to see?
A few more days of net inflows into BTC and ETH ETFs
Spot volume staying strong
Funding staying moderate or falling
BTC holding around $80K and ETH around $2.5K
Altcoin Season Index rising over time, but that would be the second stage
In this case the squeeze-driven part of the first move can get cleaned out while a healthier trend continues.
Neutral scenario: “Post-squeeze consolidation”
Even if ETF inflows continue, the short squeeze effect ends.
Price trades sideways for a few days. Funding cools and the market looks for a new direction.
This is not necessarily negative.
It can actually be healthier for the medium term because leverage decreases.
Risk scenario: “Leverage unwind”
If ETF flows weaken or turn negative while funding rises quickly again, new long crowding can build.
If price then turns lower, this time long positions can get liquidated.
The mechanism works like this:
Price falls → leveraged longs take losses → longs get liquidated → forced selling comes in → the decline accelerates.
In BTC the biggest liquidation areas below are around $78.9K–$80.0K.
This is not guaranteed technical support. But if price moves into that zone forced selling pressure can increase.
There is also liquidation concentration around $81.9K above.
The rally in BTC and ETH is supported by real demand coming through ETFs and rising spot activity; short liquidations and accelerating perp activity are making the move much stronger. But because altcoin breadth is still weak, this is not a broad altseason. It is a narrow risk-on regime led by majors and still exposed to leverage-driven volatility.