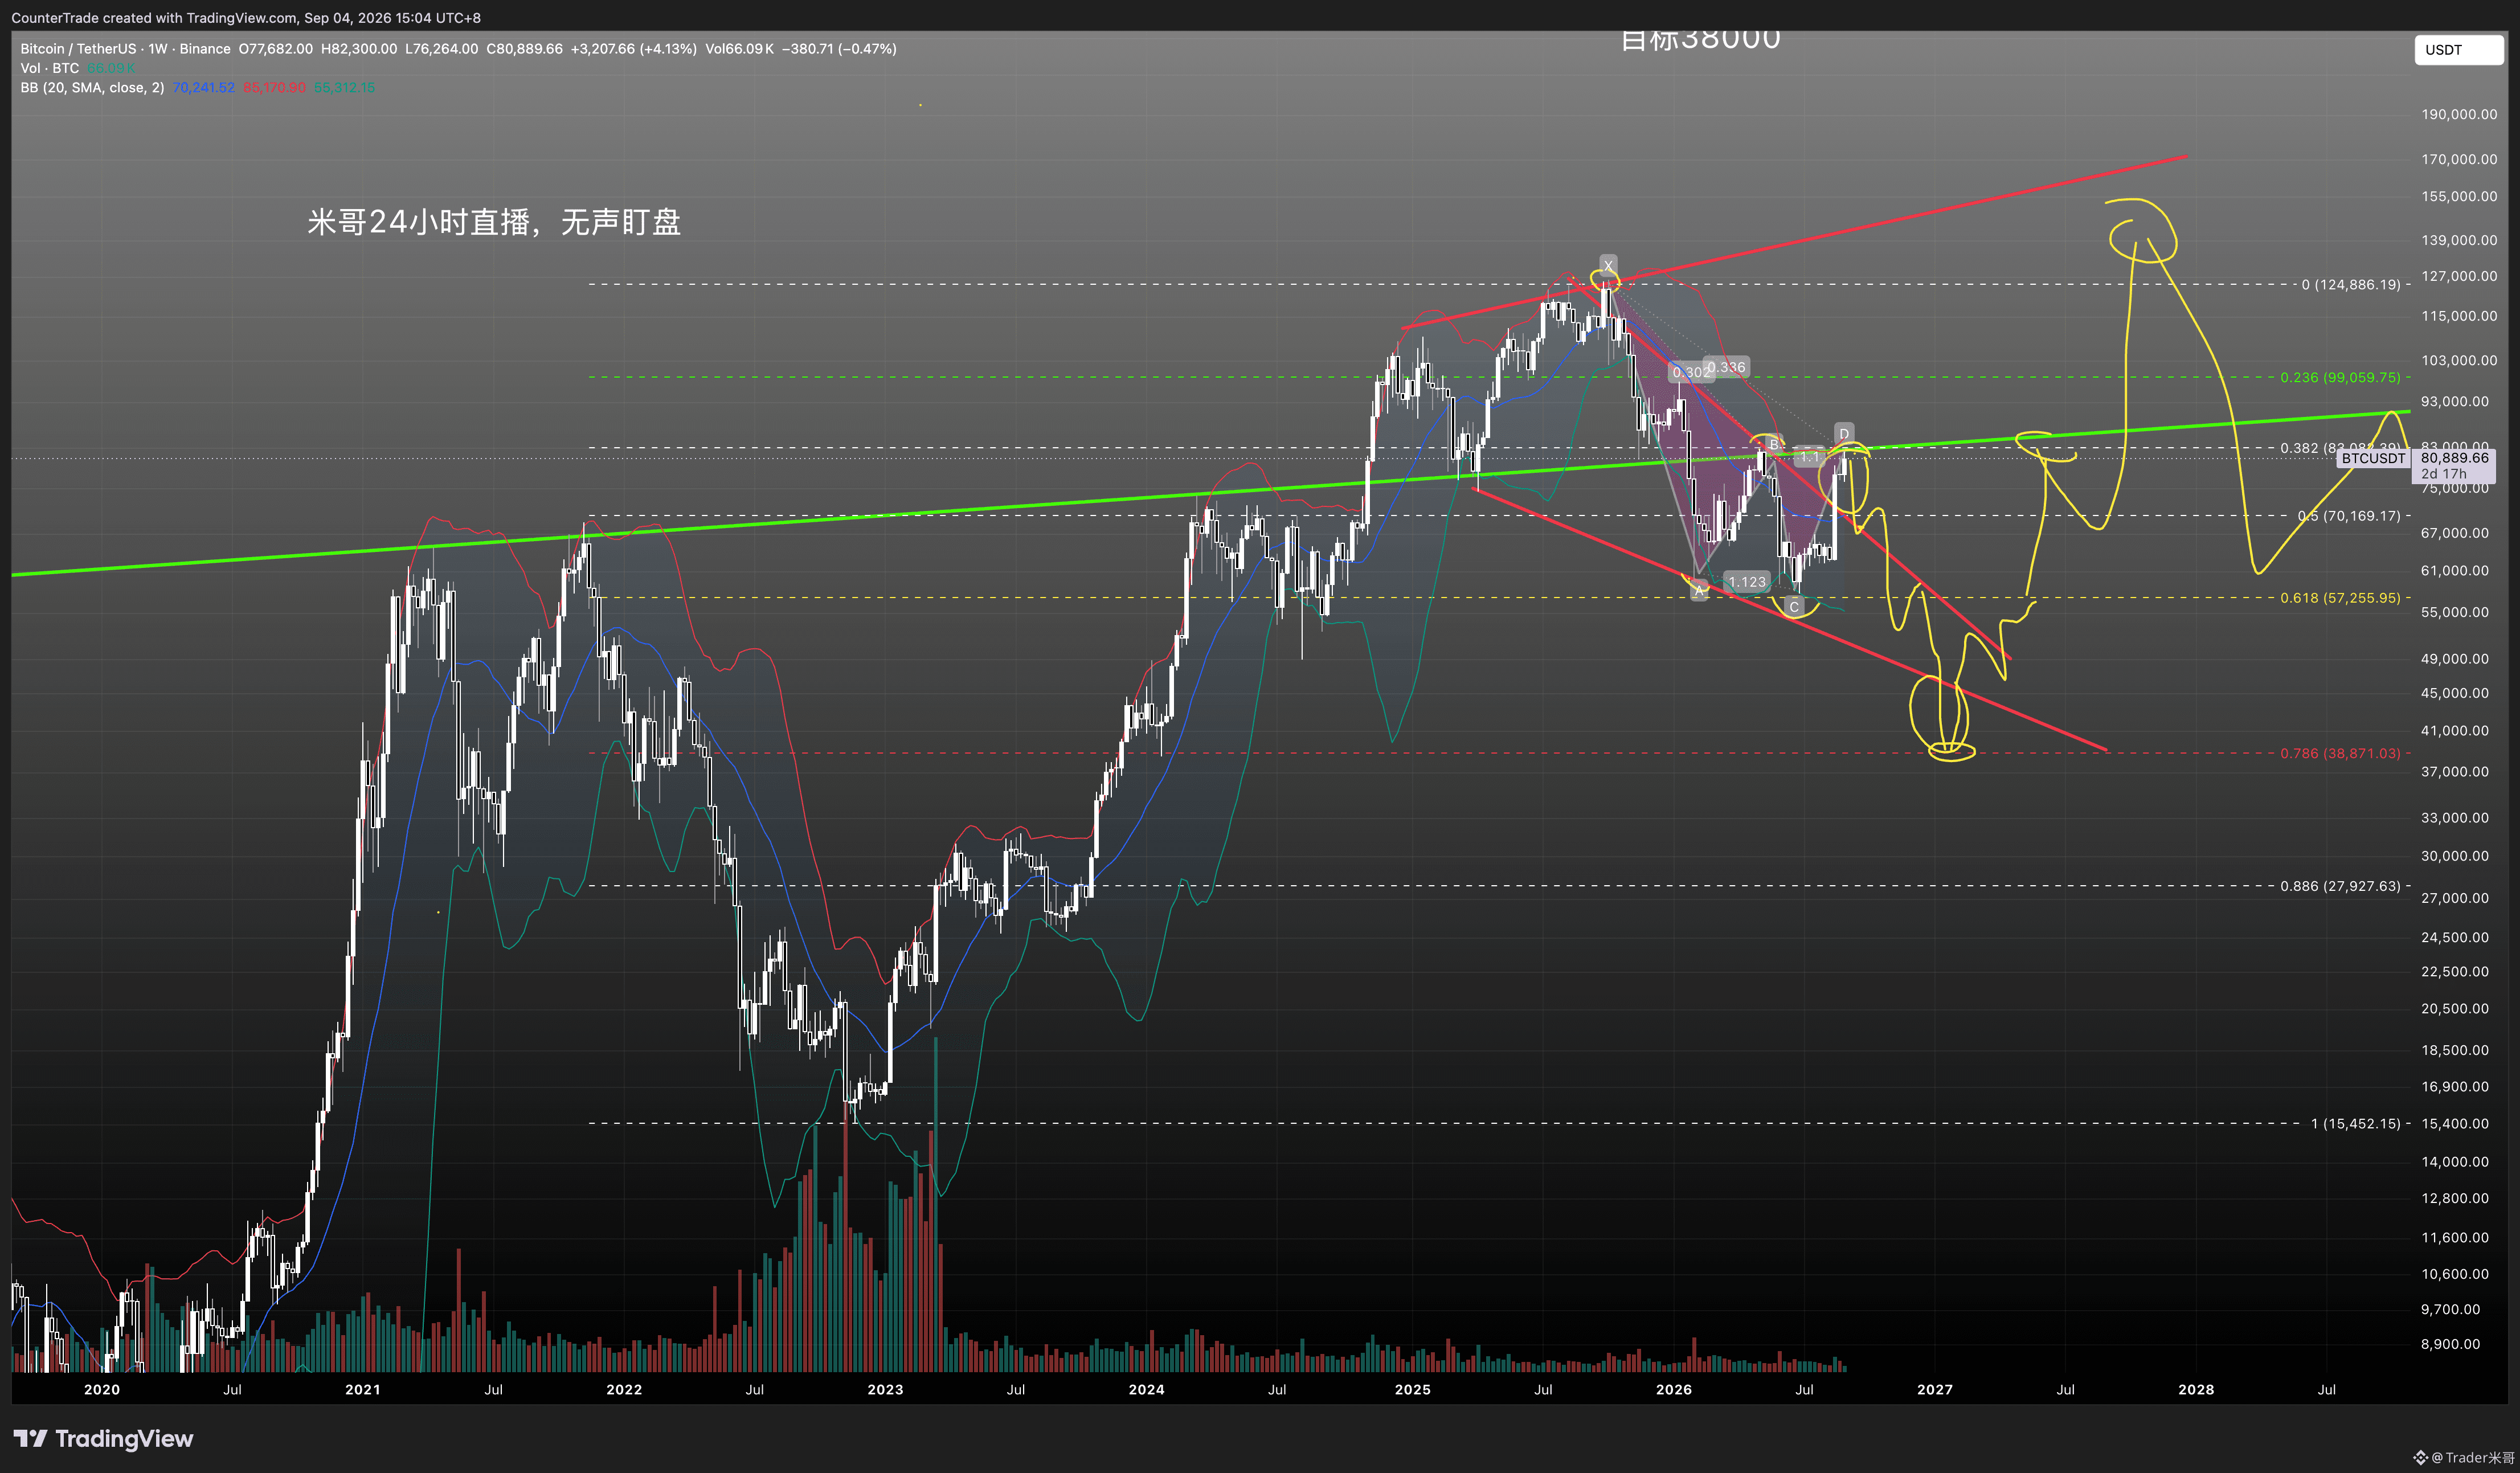
$BTC C wave has reached the end. This is likely near the top. Current price is 81k, and the Q4 price target is 38,000. Here are a few reasons:
1. The most critical point: 12,600 dropped to 57,000, only a 55% decline. This drop is not consistent with bear-market expectations. In a bear market, prices typically fall by 75% or more, because 75% is measured as a further 50% drop after a 50% decline. So from today’s perspective, it has only undergone a halving once—there needs to be another one.
2. Levels: The rebound from 57,000 up to 83k lines up exactly with a move from 0.618 back to 0.382—this is a typical fib retracement/extension swing. From a wave perspective, it looks like an ABC correction, with the current action serving as a continuation during the decline.
3. Trend line: The green trend line has been formed from 2021 to now. As long as it doesn’t break through, it implies the price should fall to the next Fibonacci support—around 38,000—down to the bottom.
Something big is coming. Stay alert!!!
1. The most critical point: 12,600 dropped to 57,000, only a 55% decline. This drop is not consistent with bear-market expectations. In a bear market, prices typically fall by 75% or more, because 75% is measured as a further 50% drop after a 50% decline. So from today’s perspective, it has only undergone a halving once—there needs to be another one.
2. Levels: The rebound from 57,000 up to 83k lines up exactly with a move from 0.618 back to 0.382—this is a typical fib retracement/extension swing. From a wave perspective, it looks like an ABC correction, with the current action serving as a continuation during the decline.
3. Trend line: The green trend line has been formed from 2021 to now. As long as it doesn’t break through, it implies the price should fall to the next Fibonacci support—around 38,000—down to the bottom.
Something big is coming. Stay alert!!!