

Many people see any rising chart and think the target is “guaranteed”…
But the truth in the market is different:
Technical analysis doesn’t predict the future; it builds possible scenarios based on price action.
The idea is simple:
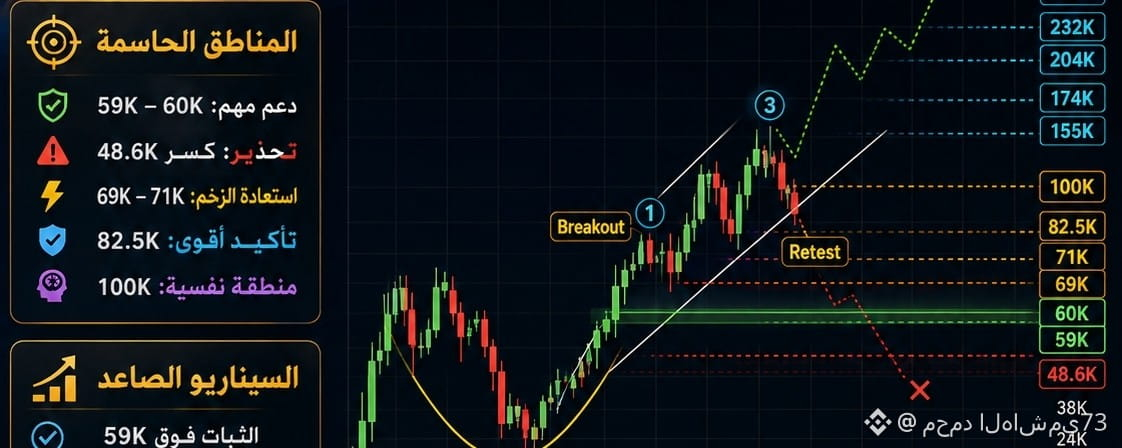
The picture explains a long-term technical pattern built on 3 main stages:
1) Breakout — breakout
It means the price succeeds in breaking an important resistance zone and starts changing the trend structure.
2) Retest — retest
After the breakout, the price often returns to test the broken zone or the new support.
And here’s the real question:
Was the breakout strong? Or just a trap?
3) Confirmation — confirmation
If the price holds and bounces strongly, the bullish scenario becomes stronger.
The key areas in the picture:
✅ 59K – 60K: important support zone
⚠️ 48.6K: breaking it weakens the bullish scenario
⚡ 69K – 71K: momentum recovery
📈 82.5K: stronger confirmation of improvement
🧠 100K: very important psychological zone
What do the distant targets mean?
Targets like:
155K / 174K / 204K / 232K
These are possible extensions if the uptrend continues and the stages are confirmed.
As for big numbers like:
327K – 333K
These are not a promise or certainty—just a hopeful scenario that needs many conditions to be fulfilled.
The gist:
Don’t enter the market just because you saw a stock or coin “drawn with a green arrow pointing up” 🚀
Enter only when you understand:
Where is the support?
Where is the resistance?
Did an actual breakout happen?
Has the retest been done?
Is there confirmation?
Because the market doesn’t reward the impatient…
The market rewards discipline.
The most important message:
Don’t treat the chart like a fortune teller.
Treat it like a price action plan:
If the first condition happens → we monitor the second
If the second is confirmed → we think about the third
But if the scenario fails → we reassess without emotion.
For educational purposes only — not a buy or sell recommendation ⚠️
E