



Arbitrum (ARB) climbed 23% in 24 hours, bringing the gain since August 31 to 61.6%. Open Interest also increased by 30% over the same period.
The rise has occurred alongside a positive funding rate, with ARB's market capitalization surpassing $904 million and record fee revenue for the Robinhood Chain.
Price drivers for ARB
ARB’s price surged thanks to strong buying demand, expanding Open Interest, and lively trading activity on the Robinhood Chain.
Coinalyze data shows Open Interest increased by 30% during the period when ARB rose 61.6% since August 31. The funding rate also turned positive after a brief dip into negative territory on September 2, indicating the market is leaning toward long positions.
ARB’s market capitalization reached $904 million, the first time it has exceeded $900 million since January. Arbitrum recorded $6.2 million in revenue in the first half of the year, while revenue related to Robinhood Chain helped push the token price.
Robinhood Chain reached a new record daily fee revenue level of $4.5 million. Arbitrum Foundation will receive 10% of the fees generated on Robinhood Chain, according to information posted on X.
Technical indicators show that ARB may adjust
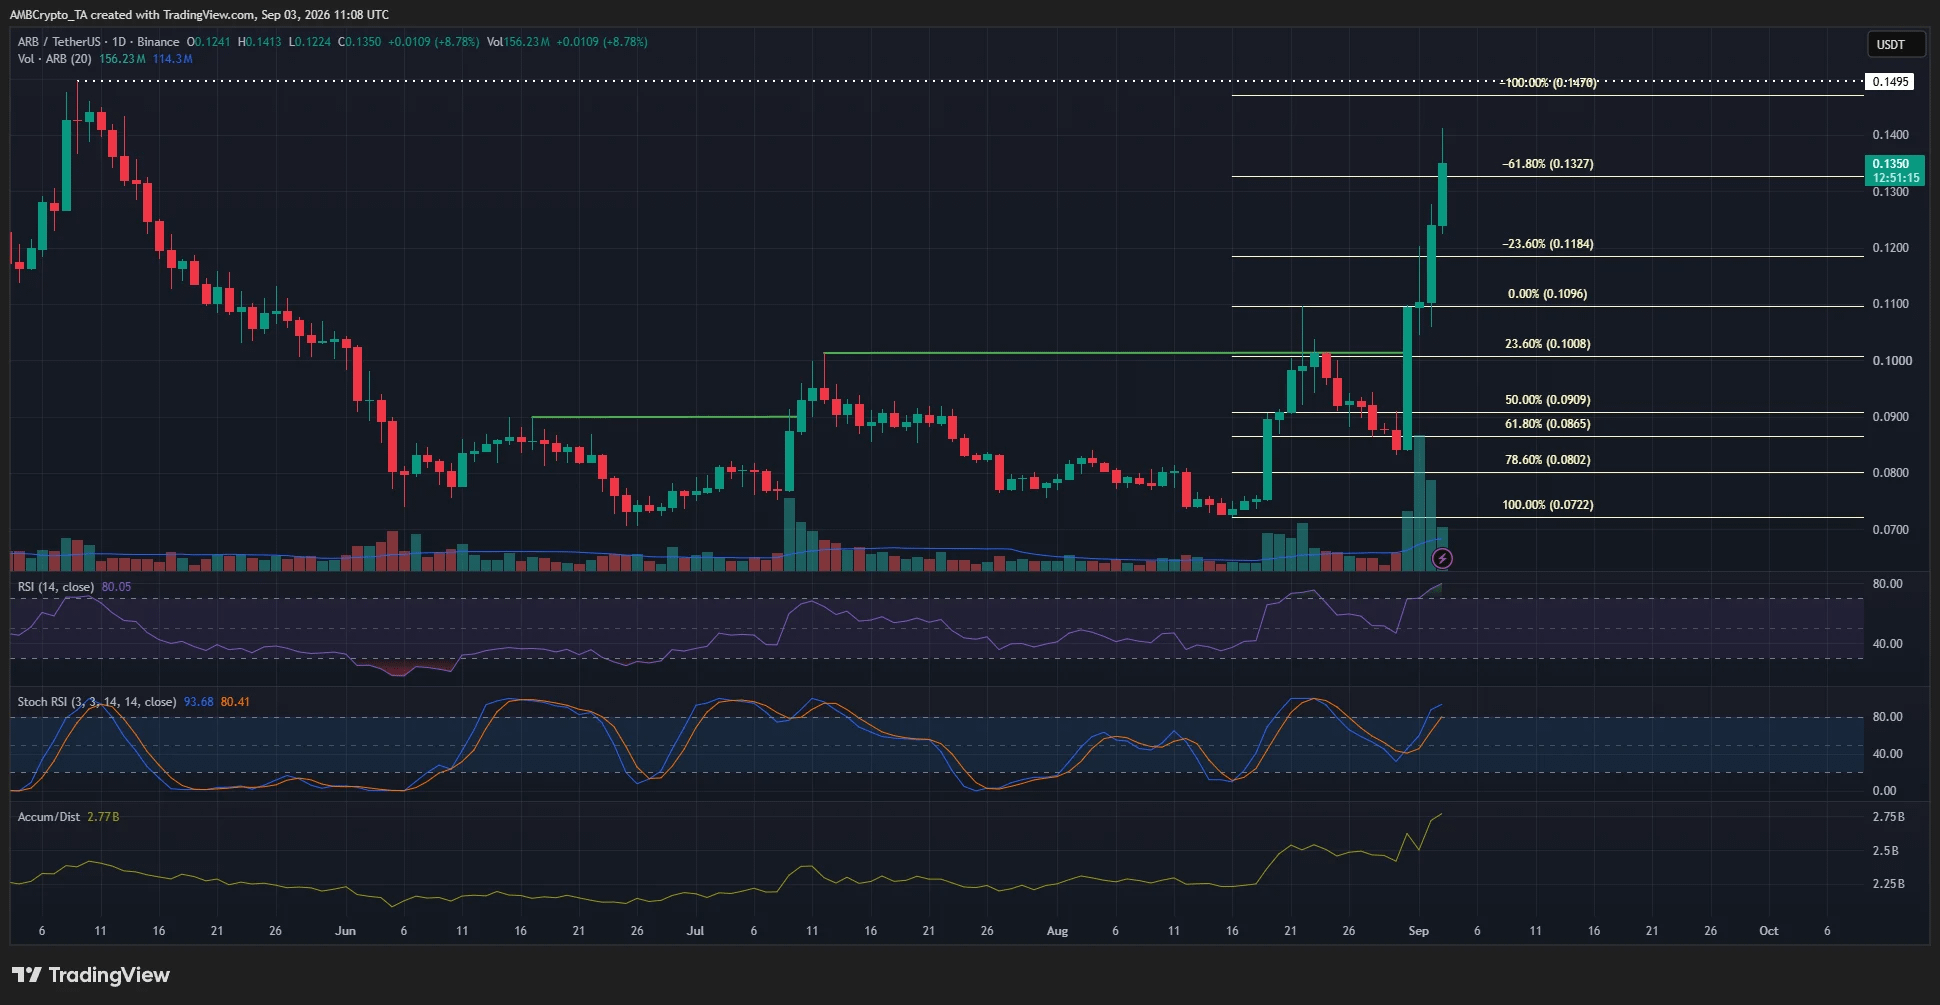
ARB is maintaining a bullish structure on the daily timeframe, but the RSI at 80.05 indicates the market has entered the overbought zone and a corrective move is possible.
 Source: ARB/USDT on TradingView
The bullish structure on the daily chart was formed starting in July and continued through August. ARB rose from $0.072 to $0.109 before retreating to around $0.08, then reversed as buying pressure increased this week.
High trading volume and strong buying pressure improved momentum and volume indicators. However, the Stochastic RSI shows signs of an impending bearish crossover, and the RSI has surpassed the 80 level for the first time since May 10, 2025.
ARB’s important price zones
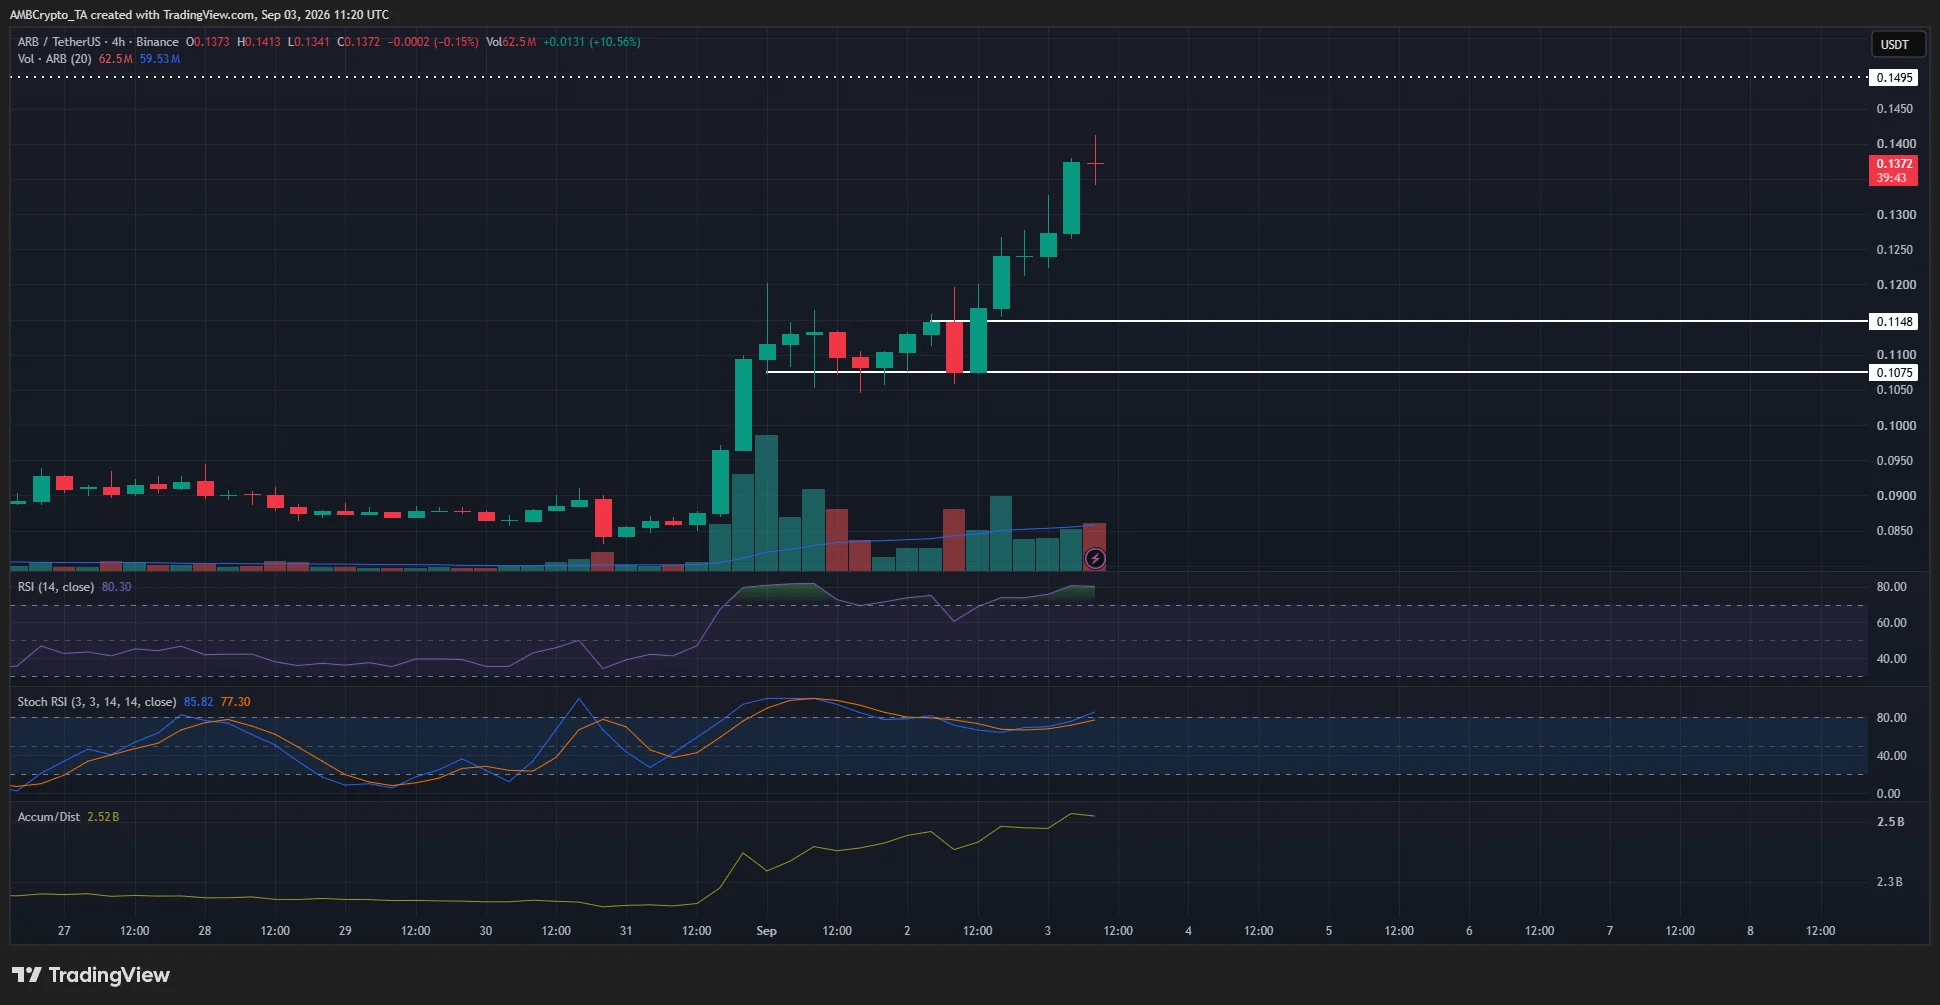
The $0.108–$0.115 zone is the area to watch if ARB pulls back, while the $0.1495 level is the resistance zone on the weekly chart.
 Source: ARB/USDT on TradingView
The strong uptrend on the higher timeframe makes the likelihood of a deep drop not clearly evident yet. However, if trading activity on Robinhood Chain slows down, ARB could face downside pressure in the short term.
Factor Value Meaning Support zone 0.108–0.115 USD An area to monitor when the price pulls back Short-term risk threshold Below 0.108 USD May shift the short-term trend downward Resistance on the weekly chart 0.1495 USD An area to break through to maintain upside potential Retest zone Around 0.150 USD Could become a confirmation zone if the price breaks above resistance
Summary
ARB surged thanks to incoming buying pressure, high Open Interest, and record fee revenue on Robinhood Chain. The RSI in the overbought zone suggests a potential correction, while the $0.108–$0.115 zone and $0.1495 resistance are notable technical levels.
Source: https://tintucbitcoin.com/du-bao-gia-arbitrum-arb-qua-mua-bao-hieu-nguy-co-giam/
Thank you for reading this article!
Like, Comment, and Follow TinTucBitcoin to stay updated with the latest news about the cryptocurrency market and not miss any important information!
$BTC $ETH $BNB $XRP $SOL