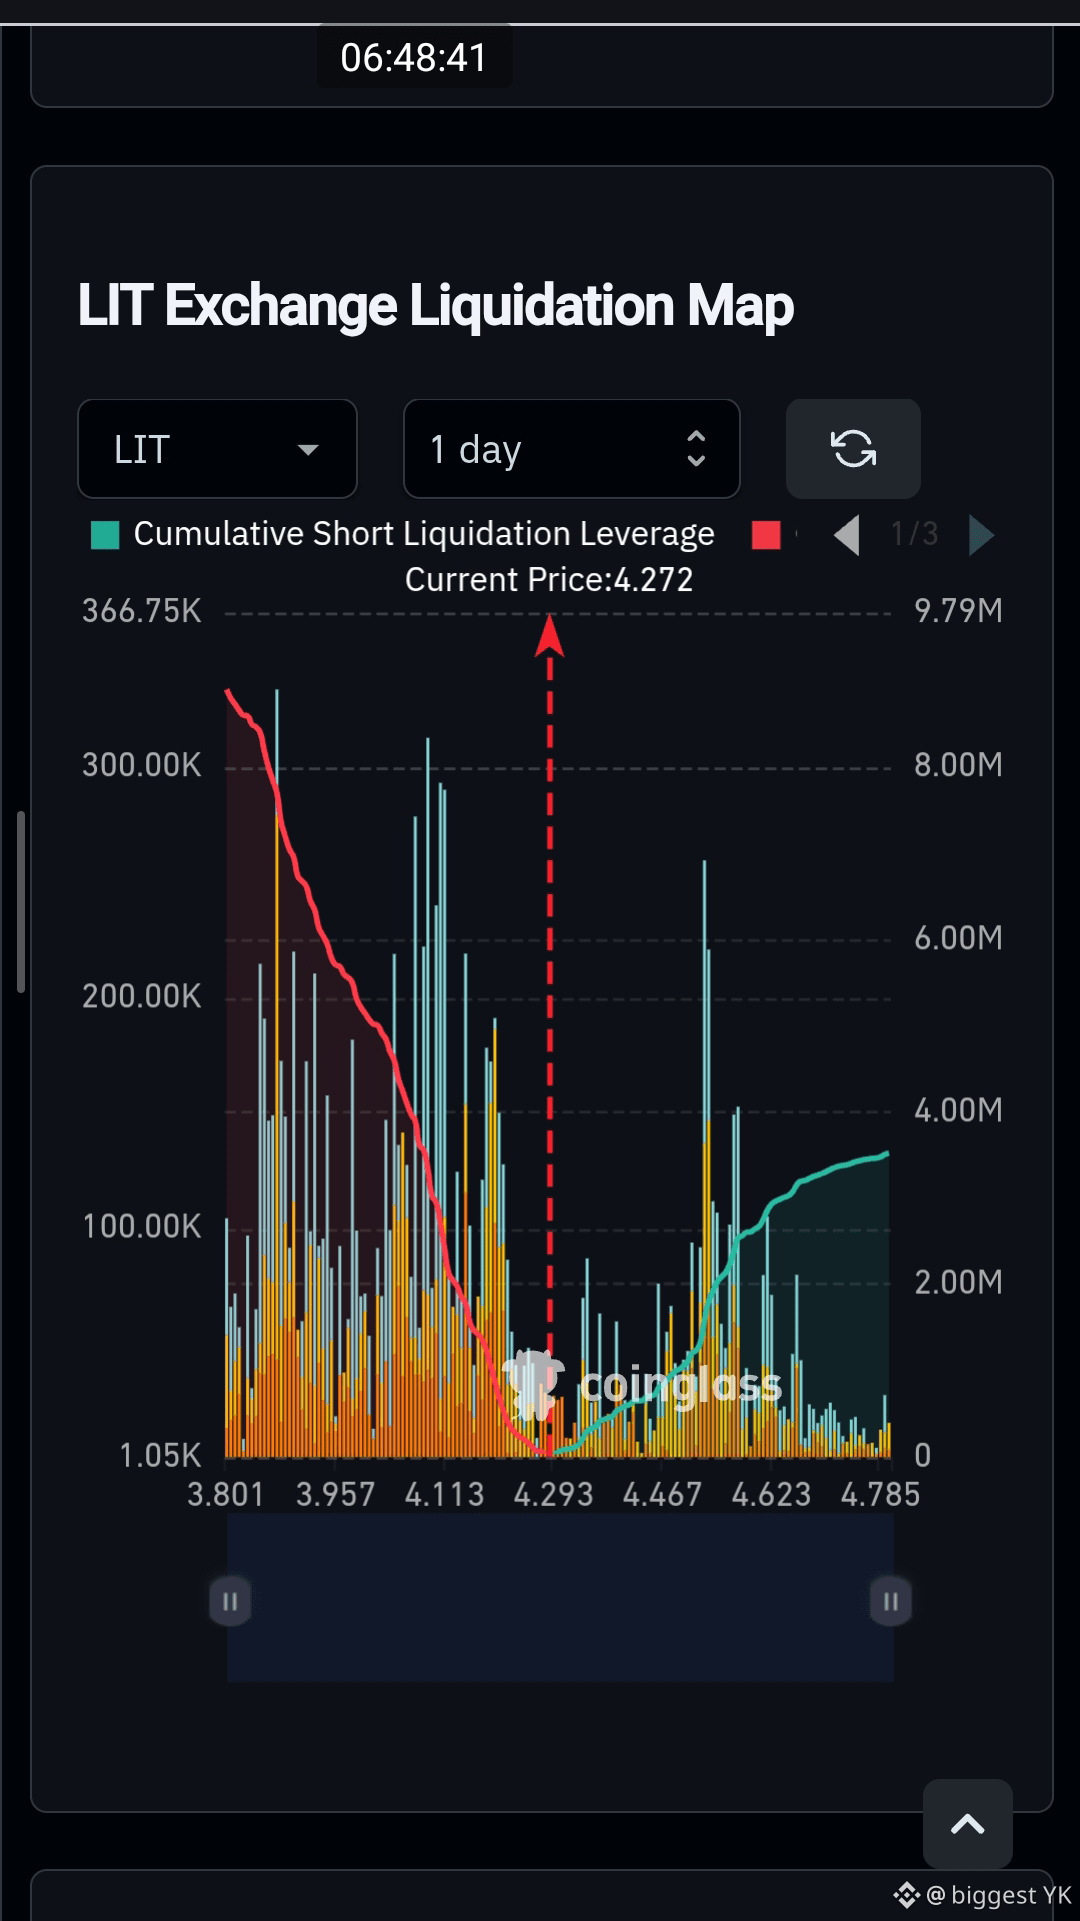
🔥 $LIT LIQUIDATION MAP SHOWS HEAVY SHORT EXPOSURE
$LIT is currently around $4.27.
🔴 Long side
• ~$4.11 → ~$130K–$160K
• ~$3.96 → ~$250K
• ~$3.80 → ~$330K cumulative
🟢 Short side
• ~$4.47 → ~$800K–$1M
• ~$4.62 → ~$2.5M–$2.8M
• ~$4.785 → ~$3.2M cumulative
The first level to watch is $4.47.
A clean break above it could expose the larger short cluster around $4.62.
If momentum remains strong beyond that level, the estimated short-liquidation exposure rises toward $3M+.
The important point is not to treat $4.78 as a guaranteed target.
Liquidation maps show potential forced-closing zones, and those zones can change as traders open, close or add margin to positions.
$LIT
$LIT is currently around $4.27.
🔴 Long side
• ~$4.11 → ~$130K–$160K
• ~$3.96 → ~$250K
• ~$3.80 → ~$330K cumulative
🟢 Short side
• ~$4.47 → ~$800K–$1M
• ~$4.62 → ~$2.5M–$2.8M
• ~$4.785 → ~$3.2M cumulative
The first level to watch is $4.47.
A clean break above it could expose the larger short cluster around $4.62.
If momentum remains strong beyond that level, the estimated short-liquidation exposure rises toward $3M+.
The important point is not to treat $4.78 as a guaranteed target.
Liquidation maps show potential forced-closing zones, and those zones can change as traders open, close or add margin to positions.
$LIT