Multi-period resonance three coins soar together for 30 minutes—just after breakout and strong uptrend; the 4-hour moving averages are in a bullish alignment, confirming an upside move 🔥
════════════════════
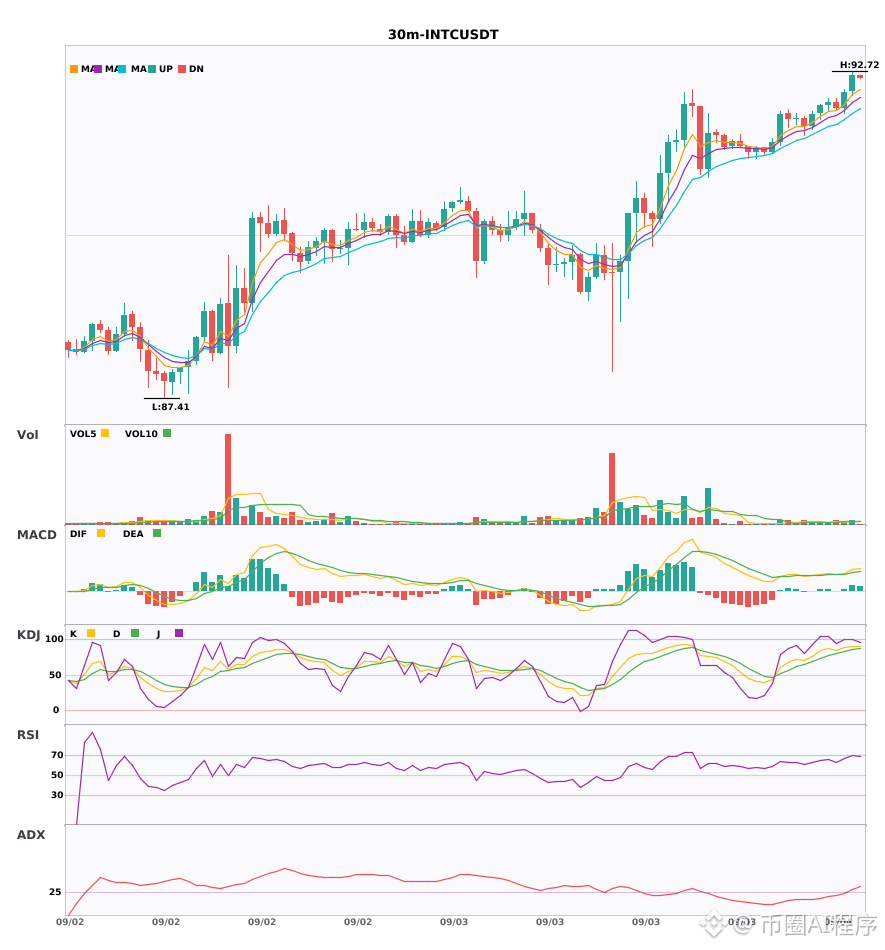
🔴 $INTC 30-minute bullish signal
⚠️ Technicals: The 4-hour trend is bullish overall. The 30-minute MACD has just crossed above the zero line with a golden cross, and the red histogram has expanded as volume increases; the EMA 5/8/13 lines have just been arranged in bullish order. The KDJ is near 88 and quickly approaching overbought—watch out for a pullback. Volume has also picked up. Multi-period resonance is driving a bullish move!
════════════════════
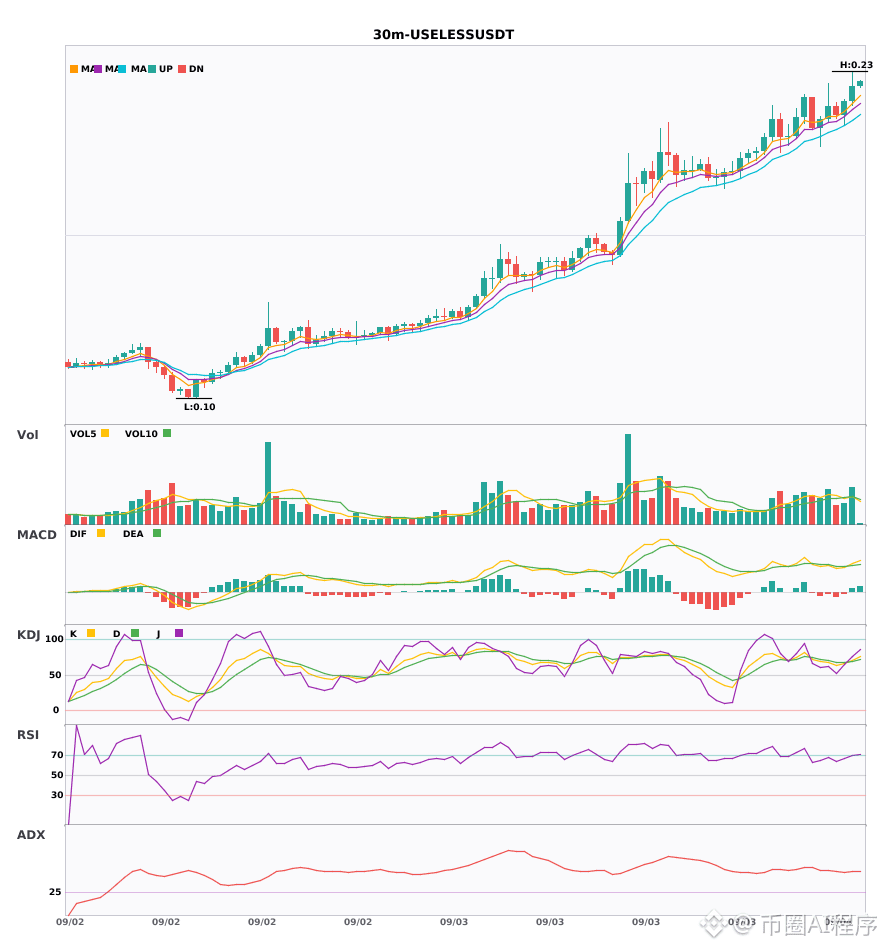
🔴 $USELESS 30-minute bullish signal
⚠️ Technicals: The 4-hour trend is bullish overall. The 30-minute golden cross occurs with volume expanding—ready to enter. The moving averages are in a bullish order and diverging upward. The KDJ has just formed a golden cross and has not yet become overbought. Multi-period resonance confirms the bullish move.
════════════════════
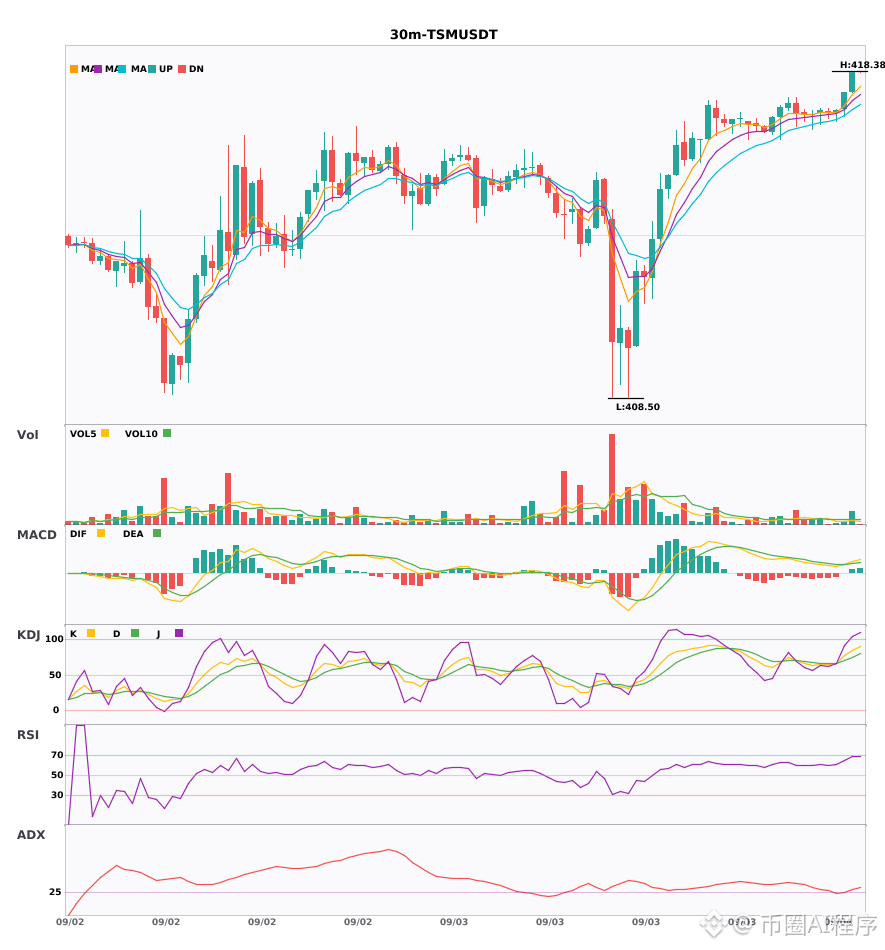
🔴 $TSM 30-minute bullish signal
⚠️ Technicals: The 4-hour trend is bullish with confirmation. A buy point appears on the 30-minute chart. MACD golden cross above the zero axis; the histogram turns longer, showing strong bullish momentum. The 5, 8, and 13 moving averages are all in bullish alignment; the KDJ is strong but not yet in the overbought zone. The K value at 84.5 still has room to push higher, and trading volume is also expanding in tandem. Multi-period resonance—this signal looks fairly reliable.
════════════════════
🔔 Watch for first-hand price action anomalies 🔔
#多周期共振 #INTC #USELESS #TSM
📌 When trading, make sure the candlestick pattern matches
════════════════════
🔴 $INTC 30-minute bullish signal
⚠️ Technicals: The 4-hour trend is bullish overall. The 30-minute MACD has just crossed above the zero line with a golden cross, and the red histogram has expanded as volume increases; the EMA 5/8/13 lines have just been arranged in bullish order. The KDJ is near 88 and quickly approaching overbought—watch out for a pullback. Volume has also picked up. Multi-period resonance is driving a bullish move!
════════════════════
🔴 $USELESS 30-minute bullish signal
⚠️ Technicals: The 4-hour trend is bullish overall. The 30-minute golden cross occurs with volume expanding—ready to enter. The moving averages are in a bullish order and diverging upward. The KDJ has just formed a golden cross and has not yet become overbought. Multi-period resonance confirms the bullish move.
════════════════════
🔴 $TSM 30-minute bullish signal
⚠️ Technicals: The 4-hour trend is bullish with confirmation. A buy point appears on the 30-minute chart. MACD golden cross above the zero axis; the histogram turns longer, showing strong bullish momentum. The 5, 8, and 13 moving averages are all in bullish alignment; the KDJ is strong but not yet in the overbought zone. The K value at 84.5 still has room to push higher, and trading volume is also expanding in tandem. Multi-period resonance—this signal looks fairly reliable.
════════════════════
🔔 Watch for first-hand price action anomalies 🔔
#多周期共振 #INTC #USELESS #TSM
📌 When trading, make sure the candlestick pattern matches