
◆━━━━━━━━━━━━━━━━━━━━━━━━━━━━━━━━◆
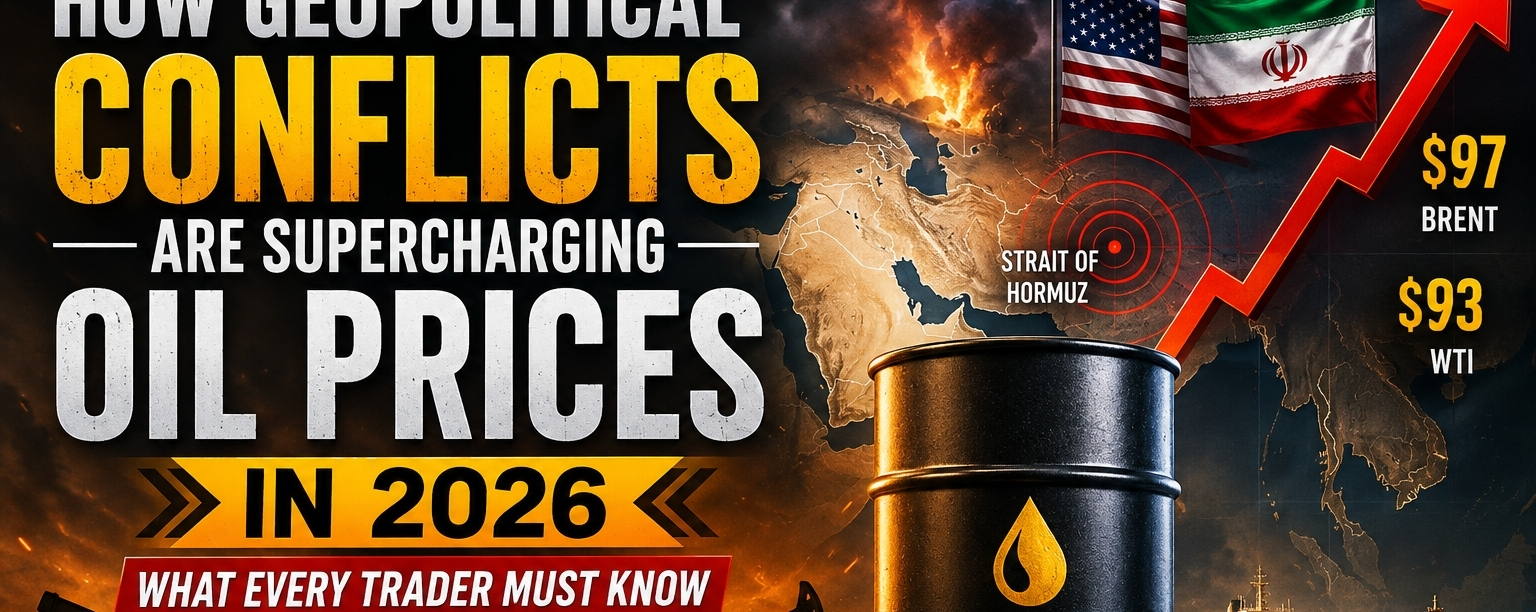
➤ Geopolitical flashpoints don’t just make headlines — they move markets with brutal speed.
✔︎ Right now, WTI Crude Oil is trading near $92.17 on, with the latest 1H chart showing MA(50) at 91.383.
✔︎ Day High: $92.443
✔︎ Day Low: $91.694
✔︎ Price remains well above levels seen just weeks ago.
➜ This isn’t random market noise. It reflects the ongoing geopolitical risk premium tied to prolonged Middle East tensions, especially around the Strait of Hormuz.
◆━━━━━━━━━━━━━━━━━━━━━━━━━━━━━━━━◆
➤ Latest Market
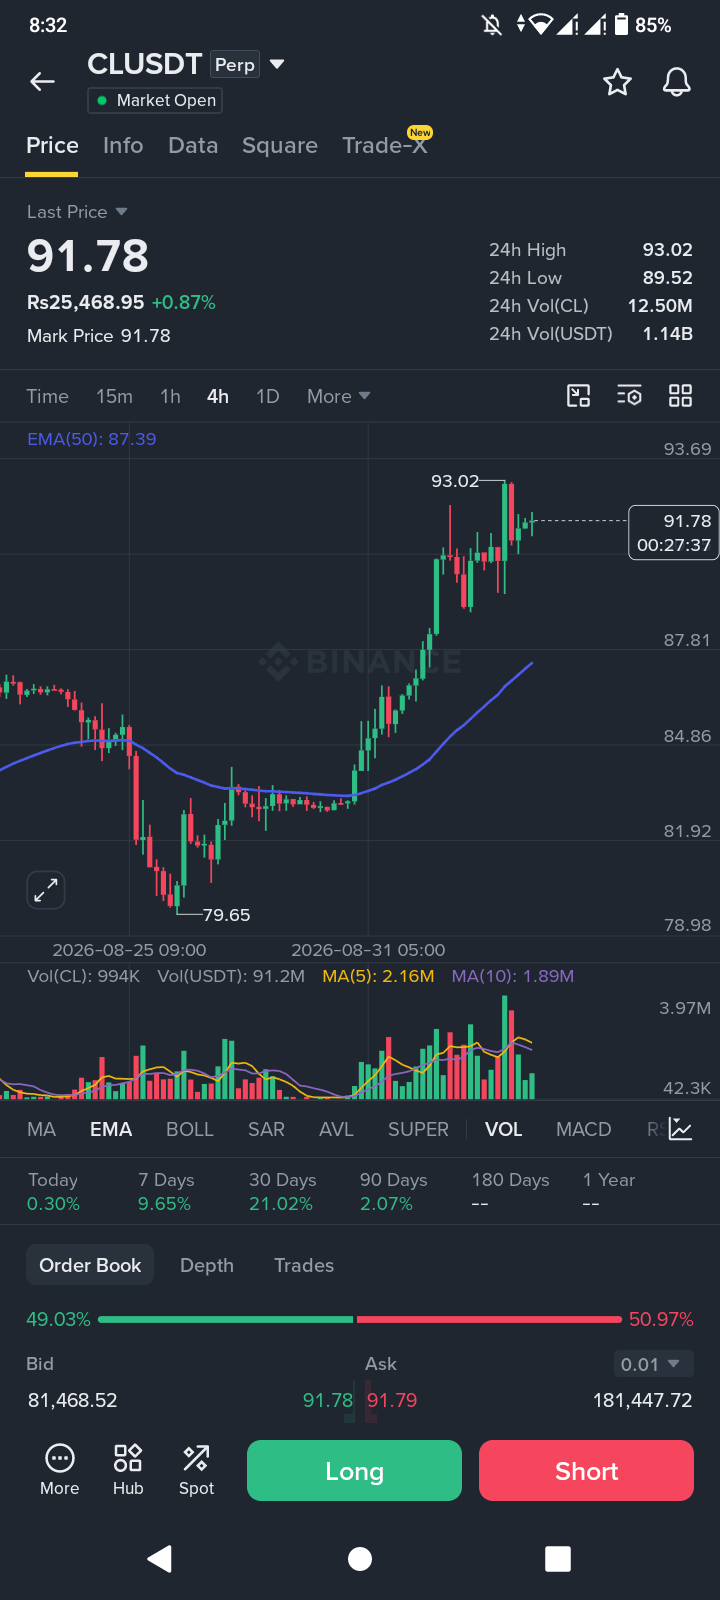
✔︎ WTI (USOUSD CFD) hovering around $92.17–$92.20
✔︎ Positive momentum remains intact
✔︎ MA(50) continues sloping upward
✔︎ Recovery from the mid-$80s remains firmly in place
✔︎ Regular-hours trading shows steady buying interest
✔︎ Recently traded near $91.36
✔︎ Elevated 24h trading range
✔︎ Strong open interest remains visible
✔︎ Funding and volume suggest active positioning around geopolitical risk
③ Broader Market Data
✔︎ WTI futures recently closed near $91.50–$92.00
✔︎ Intraday spikes approached $93
✔︎ Brent crude remains in the mid-$95s
✔︎ Multi-week highs are being driven primarily by supply-risk concerns rather than pure demand growth
➜ Traditional oil is not listed like cryptocurrencies on CoinMarketCap or CoinGecko. Commodity CFDs and perpetual contracts on exchanges such as Bitget and Binance remain the preferred instruments for many traders seeking oil exposure.
◆━━━━━━━━━━━━━━━━━━━━━━━━━━━━━━━━◆
◆ How Geopolitical Conflicts Actually Move Oil
① Supply Chokepoints Matter Most
✔︎ The Strait of Hormuz normally handles roughly one-fifth of global oil trade.
✔︎ Even partial disruptions, tanker rerouting, or security threats can quickly force markets to price in additional risk.
✔︎ Reduced shipping activity keeps physical oil balances tighter than normal.
② Risk Premium Expands Rapidly
✔︎ Military escalation, shipping incidents, or retaliation concerns can trigger sharp price spikes.
✔︎ De-escalation headlines can remove that premium just as quickly.
✔︎ Earlier in 2026, prices retreated into the $70s–$80s before rebounding as tensions resurfaced.
③ Secondary Effects Amplify the Move
✔︎ Higher crude prices push up refined fuel costs.
✔︎ Shipping and insurance expenses increase.
✔︎ Inflation expectations can rise.
✔︎ Inventory draws add additional bullish pressure.
④ Market Buffers Have Limits
✔︎ Strategic reserves and alternative supply routes provide some protection.
✔︎ Demand fluctuations can soften supply shocks.
✔︎ However, prolonged uncertainty keeps a strong floor under prices.
✔︎ Analysts have generally raised second-half 2026 forecasts because the geopolitical environment is no longer viewed as temporary.
◆━━━━━━━━━━━━━━━━━━━━━━━━━━━━━━━━◆
➜ Trading Implications for the Current Setup
✔︎ WTI continues holding above a rising MA(50).
✔︎ Recent price structure shows a series of higher lows following the rally.
Key Levels To Watch
➤ Resistance: $93.00 – $94.50
➤ Support: MA(50) zone and $90.00 – $91.00
➤ Volatility: Remains elevated
What This Means
✔︎ Range-trading opportunities remain active.
✔︎ Breakout setups could emerge if resistance is cleared.
✔︎ Risk management and disciplined stop placement remain essential.
➜ Longer term, the market appears to be pricing a higher-floor scenario.
✔︎ If critical shipping routes remain constrained, the $80s could act as support rather than resistance.
✔︎ If tensions ease and tanker traffic normalizes, a sharp mean-reversion move lower remains possible.
◆━━━━━━━━━━━━━━━━━━━━━━━━━━━━━━━━◆
◆ Bottom Line
✔︎ Geopolitical conflicts do not permanently redefine oil prices overnight.
✔︎ They do, however, force markets to continuously reprice risk in real time.
✔︎ WTI trading near $92 reflects that ongoing recalibration.
➜ Stay data-driven.
➜ Monitor shipping activity closely.
➜ Track inventory reports and supply developments.
➜ Treat geopolitical premiums as dynamic variables rather than fixed assumptions.
◆━━━━━━━━━━━━━━━━━━━━━━━━━━━━━━━━◆
➤ What Are You Seeing On The Charts?
① Bullish continuation above the MA?
② Resistance rejection near $93–$94.50?
③ A deeper pullback before the next leg higher?
✔︎ Drop your analysis, key levels, and favorite setups in the comments.
✔︎ If this breakdown helped you better understand the oil–geopolitics connection, share it with your trading circle.
➜ Trade informed, not emotional.
◆━━━━━━━━━━━━━━━━━━━━━━━━━━━━━━━━◆
Stay Sharp. Stay Disciplined. Stay Ahead.
◆━━━━━━━━━━━━━━━━━━━━━━━━━━━━━━━━◆
#BTCTops$80K #USWeeklyInitialJoblessClaimsRiseTo206000 #SnowflakeSurges24%OnEarningsBeat $CL