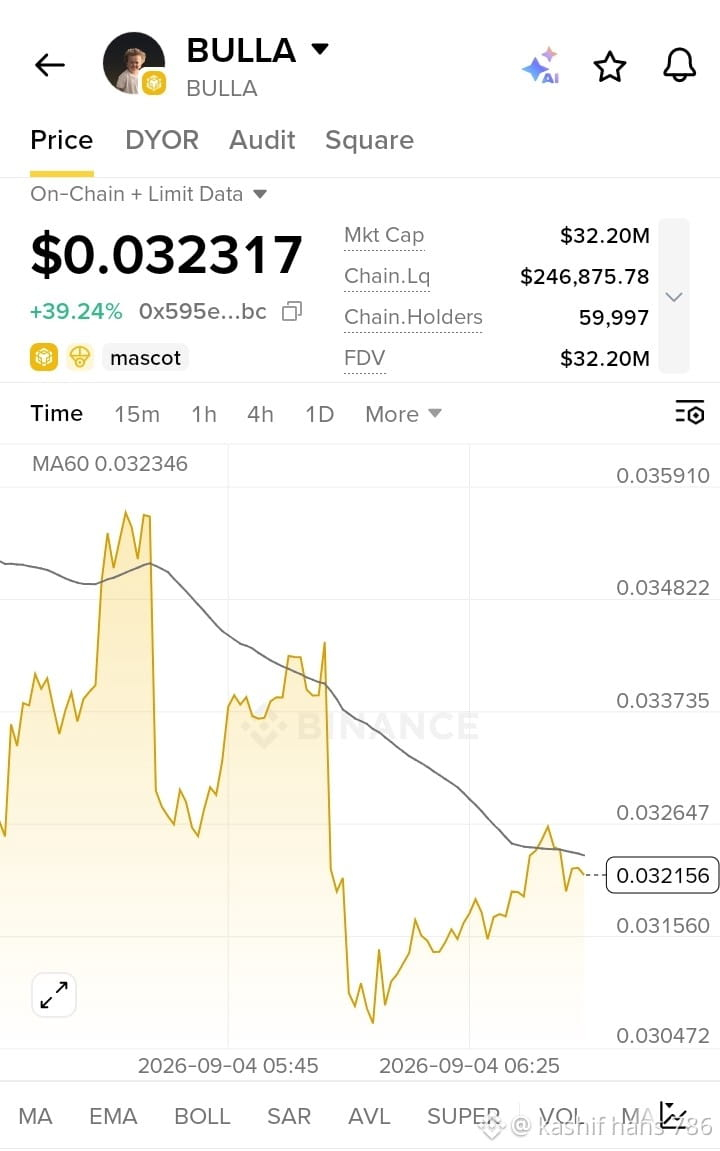
$BULLA is showing strong short-term momentum, but the move is already very extended.
Current: ~$0.03232, about +39%
Immediate resistance: $0.03374, then $0.03482–$0.03591
Support: $0.03216, then $0.03156
MA60: ~$0.03235 — price is sitting almost exactly around it.
The broader breakout is notable: recent analysis identified $0.03012 as an important resistance area.
Current market data also shows BULLA trading with unusually high volatility and a large intraday range.
Chart read: 🟢 Bullish above $0.03216–$0.03156.
A clean break and hold above $0.03482–$0.03591 would strengthen the bullish setup. If it loses $0.03156, momentum could cool and a deeper pullback becomes more likely.
Because the move is already around +40%, chasing the candle is higher-risk; waiting for confirmation is generally more sensible.
Current: ~$0.03232, about +39%
Immediate resistance: $0.03374, then $0.03482–$0.03591
Support: $0.03216, then $0.03156
MA60: ~$0.03235 — price is sitting almost exactly around it.
The broader breakout is notable: recent analysis identified $0.03012 as an important resistance area.
Current market data also shows BULLA trading with unusually high volatility and a large intraday range.
Chart read: 🟢 Bullish above $0.03216–$0.03156.
A clean break and hold above $0.03482–$0.03591 would strengthen the bullish setup. If it loses $0.03156, momentum could cool and a deeper pullback becomes more likely.
Because the move is already around +40%, chasing the candle is higher-risk; waiting for confirmation is generally more sensible.