$EDGE /USDT — Technical Analysis
Based on the chart data you shared:
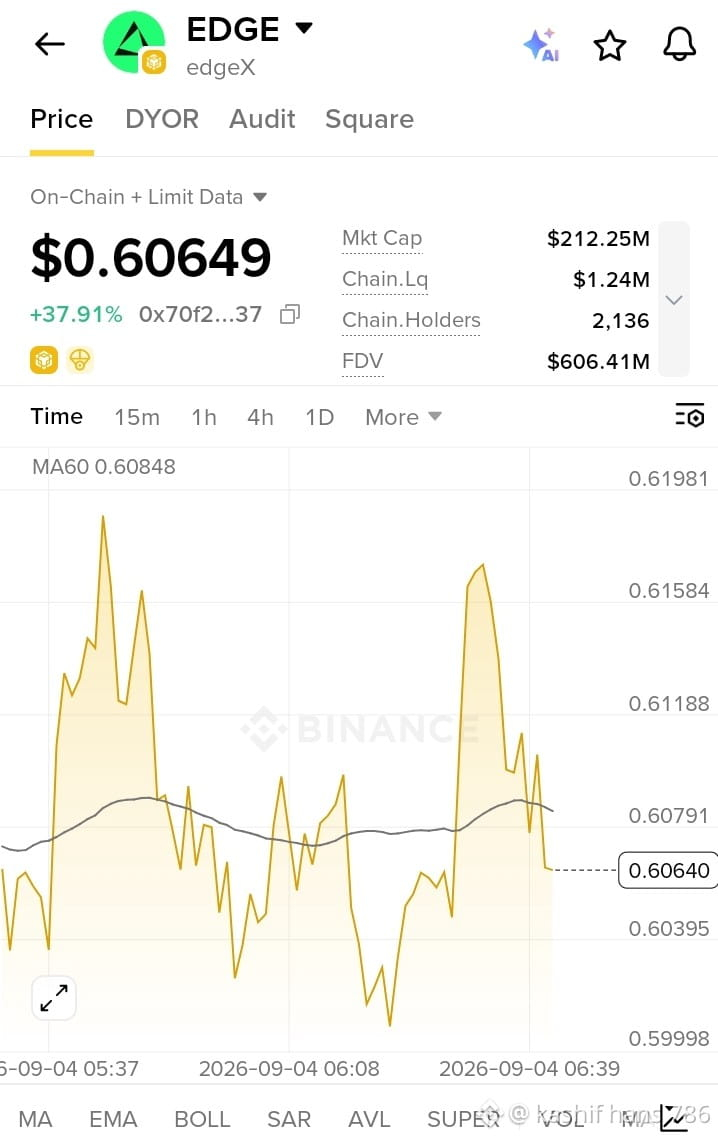
Current price: $0.60649
24h move: +37.91% — very strong bullish momentum.
MA60: $0.60848, so price is currently sitting just below this level.
Immediate resistance: $0.6158–$0.6198
Immediate support: $0.6039–$0.6060
Next support: around $0.6000
Bias: 🟢 Bullish, but highly volatile after such a large move. EDGE has also been seeing unusually strong market activity recently.
Key levels:
A sustained break above $0.620 could indicate further upside momentum.
Losing $0.604 would weaken the short-term setup.
Below $0.600, the bullish structure becomes less convincing.
Since this is a very fast move, avoid treating the levels as guaranteed targets. For your next check, watch whether the 15m candle closes above $0.620 or gets rejected there.
Based on the chart data you shared:
Current price: $0.60649
24h move: +37.91% — very strong bullish momentum.
MA60: $0.60848, so price is currently sitting just below this level.
Immediate resistance: $0.6158–$0.6198
Immediate support: $0.6039–$0.6060
Next support: around $0.6000
Bias: 🟢 Bullish, but highly volatile after such a large move. EDGE has also been seeing unusually strong market activity recently.
Key levels:
A sustained break above $0.620 could indicate further upside momentum.
Losing $0.604 would weaken the short-term setup.
Below $0.600, the bullish structure becomes less convincing.
Since this is a very fast move, avoid treating the levels as guaranteed targets. For your next check, watch whether the 15m candle closes above $0.620 or gets rejected there.