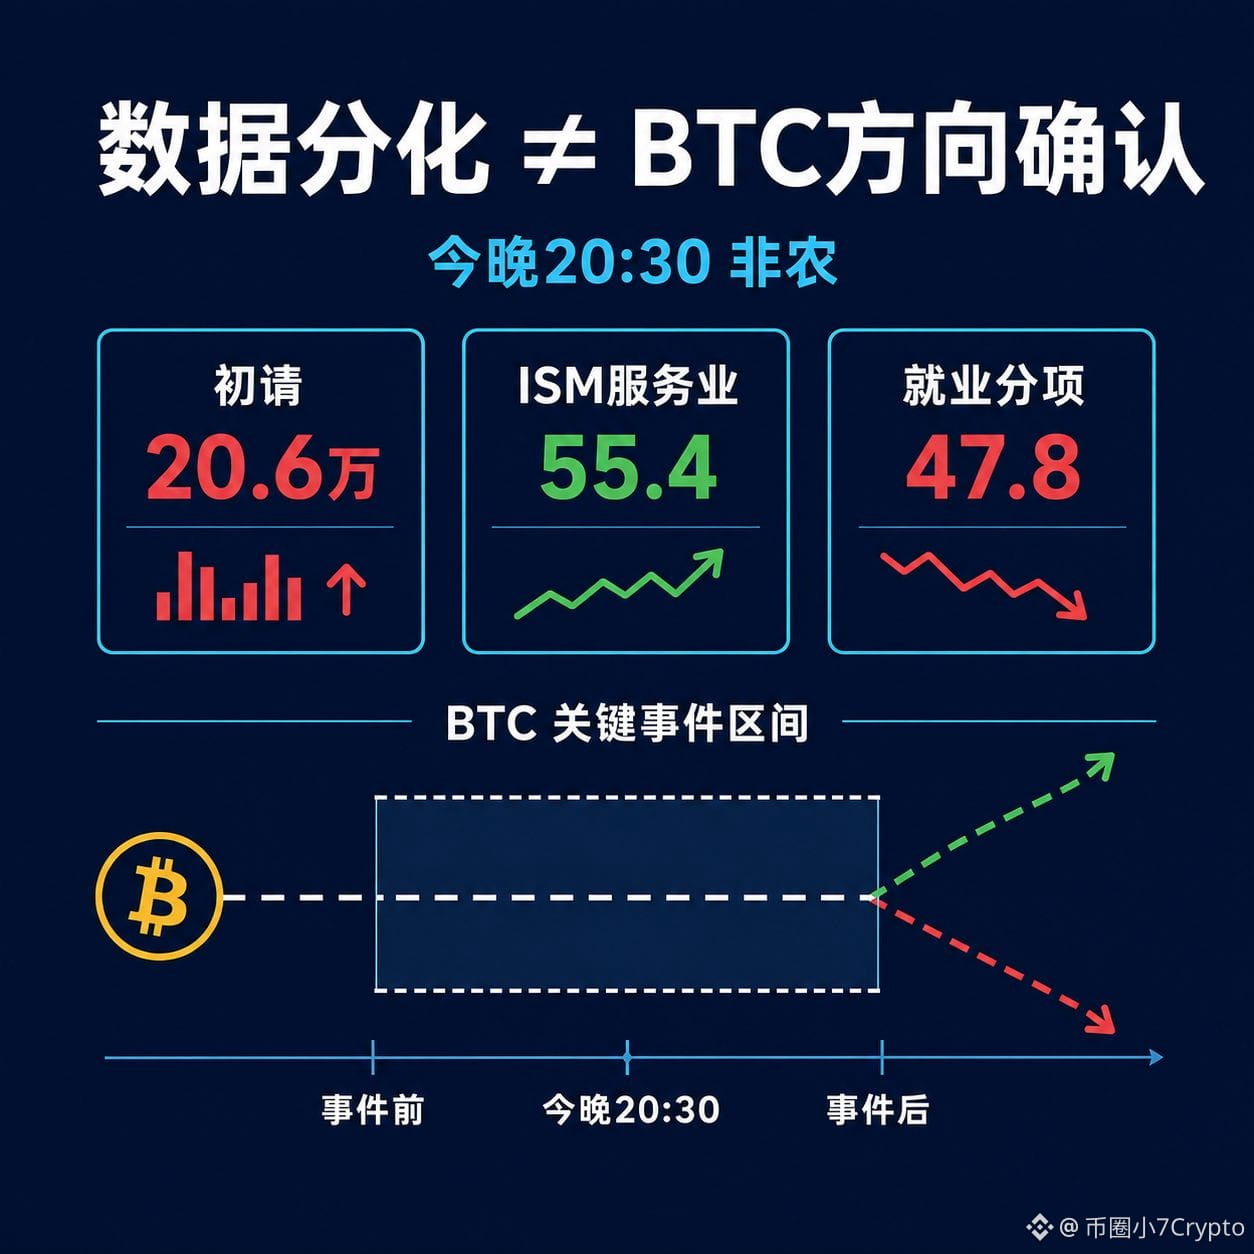
Before the Non-Farm Payrolls release tonight, three sets of U.S. data did not give $BTC a one-way answer.
According to data from the U.S. Department of Labor:
- For the week ending August 29, initial jobless claims were 206,000, up by 2,000 from the revised prior figure;
- The four-week moving average rose to 207.25k;
- Continuing jobless claims were 1.779 million, up by 8,000 from the revised prior figure.
Therefore, it’s not as simple as describing the continuing claims as “declining.” The prior revisions and the comparison base differ, which can easily cause directional mismatches between news headlines and official reports.
On the other hand, the August ISM Services Index rose to 55.4, indicating that demand is still expanding; but the employment sub-index was only 47.8, still within a contraction range, while the prices sub-index rose to 72.6.
Putting these data together, the situation is more like this:
Service demand is relatively strong, firms are hiring cautiously, and price pressure remains high.
This is not simply “weaker data = BTC rises,” and it’s not “strong economy = BTC falls.” Tonight at 20:30 Beijing time, the U.S. Bureau of Labor Statistics will release the August employment report. At that time, I’ll focus more on:
1. Where the first big K-line closes after the data is released;
2. After the market breaks out of the prior range, whether there are consecutive closes and continuation;
3. If it quickly returns to the original range, whether this breakout was only a liquidity sweep.
Macroeconomic data creates volatility; price action is what confirms which direction the market ultimately accepts.
When you look at the data-driven market, do you chase the first wave, or do you wait for confirmation within the event range?
#US initial jobless claims rise to 206k #US August ISM services index rises to 55.4 #BTC #price action
Data sources: U.S. Department of Labor, ISM, U.S. Bureau of Labor Statistics. For market research and price-action learning only; not investment advice.
According to data from the U.S. Department of Labor:
- For the week ending August 29, initial jobless claims were 206,000, up by 2,000 from the revised prior figure;
- The four-week moving average rose to 207.25k;
- Continuing jobless claims were 1.779 million, up by 8,000 from the revised prior figure.
Therefore, it’s not as simple as describing the continuing claims as “declining.” The prior revisions and the comparison base differ, which can easily cause directional mismatches between news headlines and official reports.
On the other hand, the August ISM Services Index rose to 55.4, indicating that demand is still expanding; but the employment sub-index was only 47.8, still within a contraction range, while the prices sub-index rose to 72.6.
Putting these data together, the situation is more like this:
Service demand is relatively strong, firms are hiring cautiously, and price pressure remains high.
This is not simply “weaker data = BTC rises,” and it’s not “strong economy = BTC falls.” Tonight at 20:30 Beijing time, the U.S. Bureau of Labor Statistics will release the August employment report. At that time, I’ll focus more on:
1. Where the first big K-line closes after the data is released;
2. After the market breaks out of the prior range, whether there are consecutive closes and continuation;
3. If it quickly returns to the original range, whether this breakout was only a liquidity sweep.
Macroeconomic data creates volatility; price action is what confirms which direction the market ultimately accepts.
When you look at the data-driven market, do you chase the first wave, or do you wait for confirmation within the event range?
#US initial jobless claims rise to 206k #US August ISM services index rises to 55.4 #BTC #price action
Data sources: U.S. Department of Labor, ISM, U.S. Bureau of Labor Statistics. For market research and price-action learning only; not investment advice.