Trading Ideas|9/4 07:21
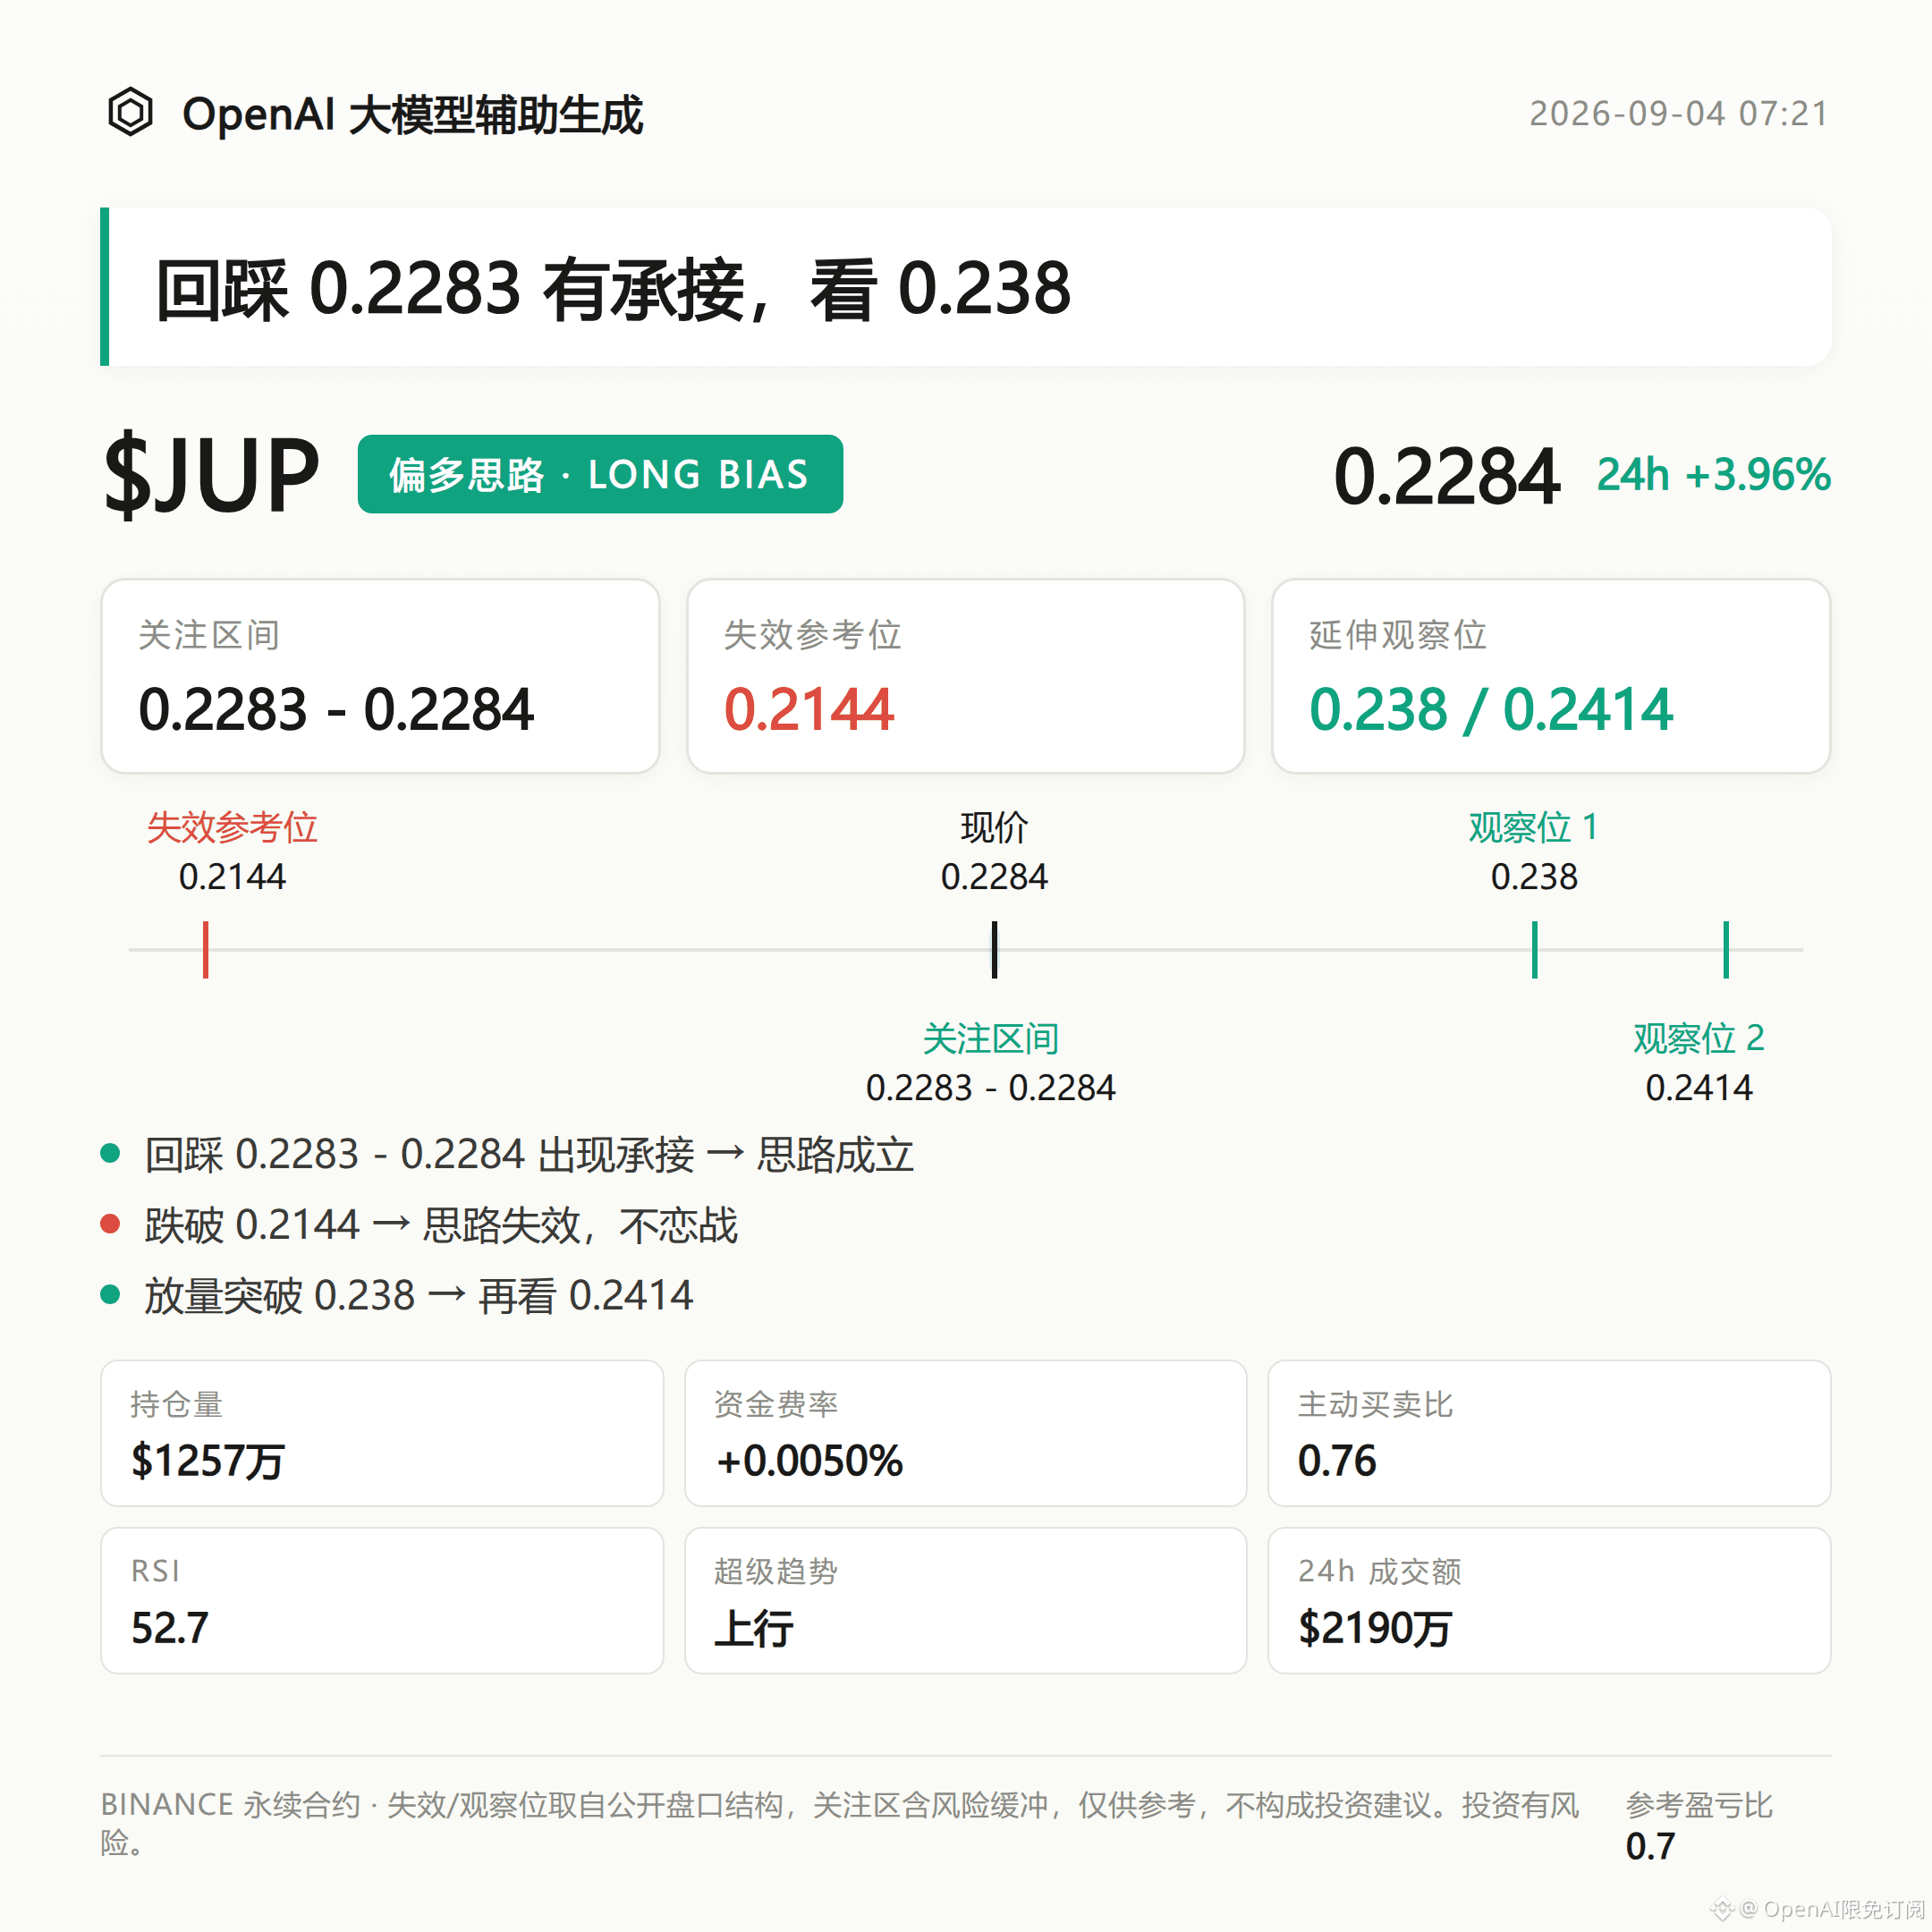
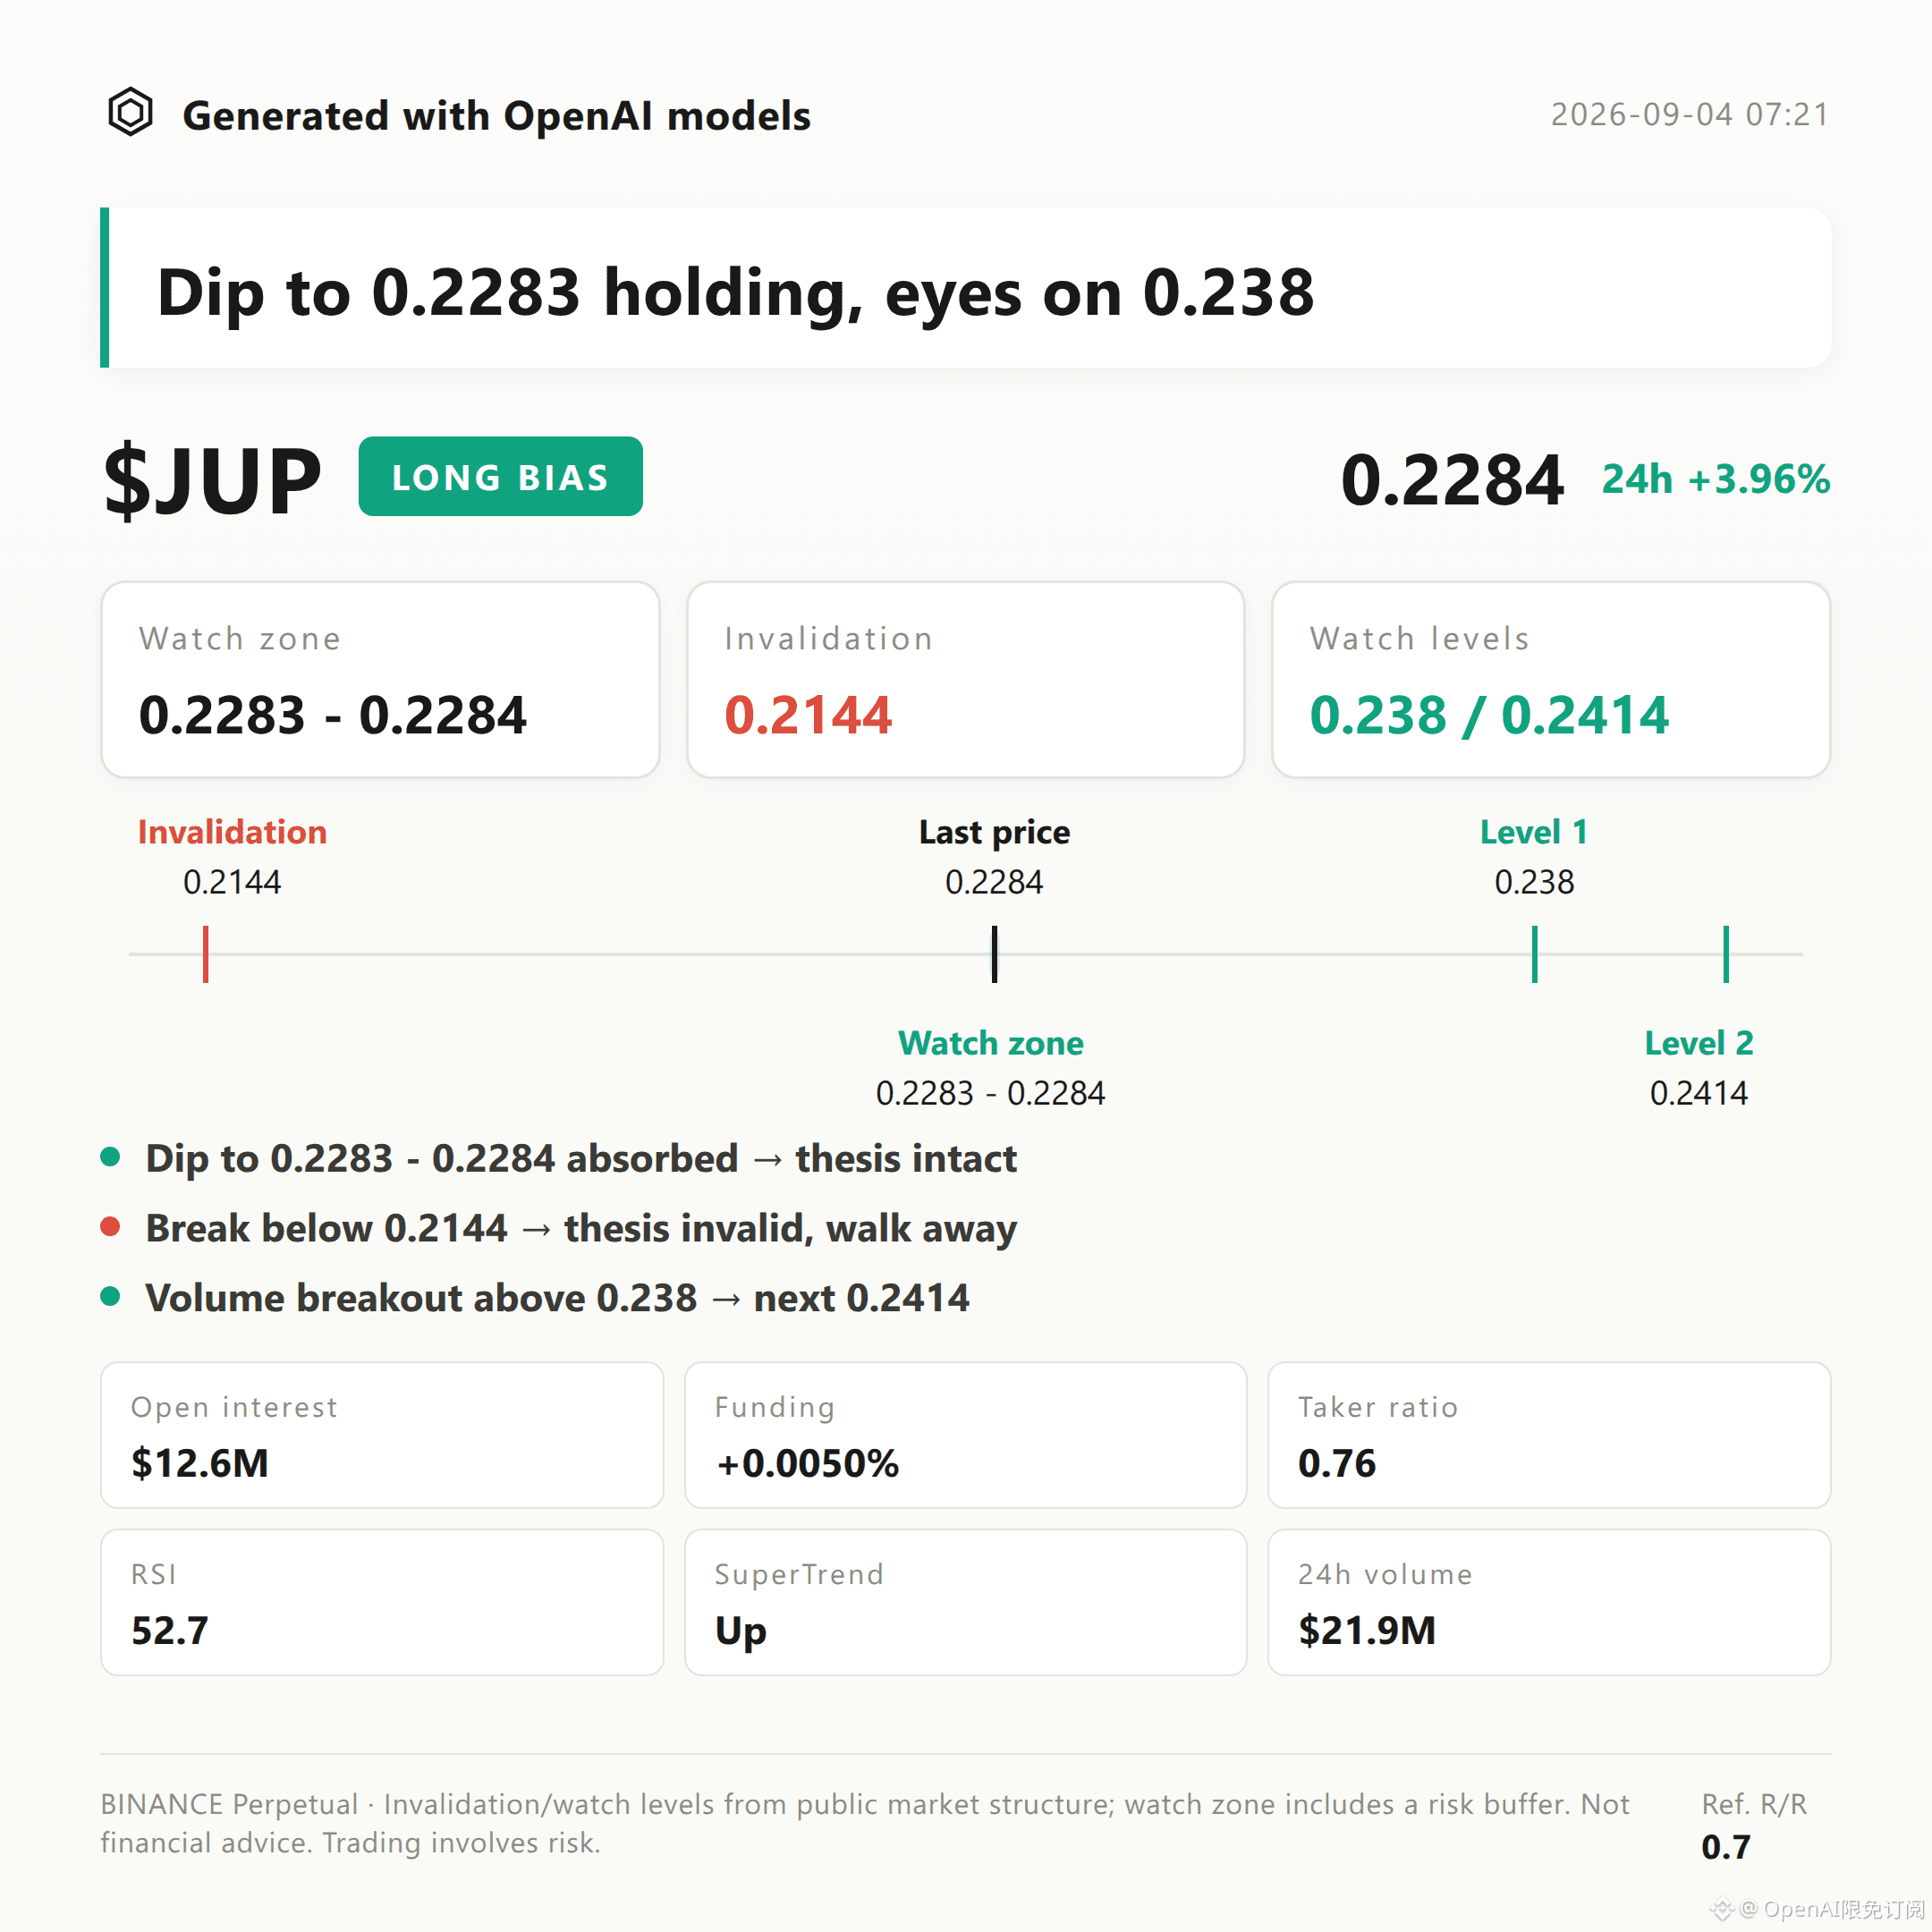
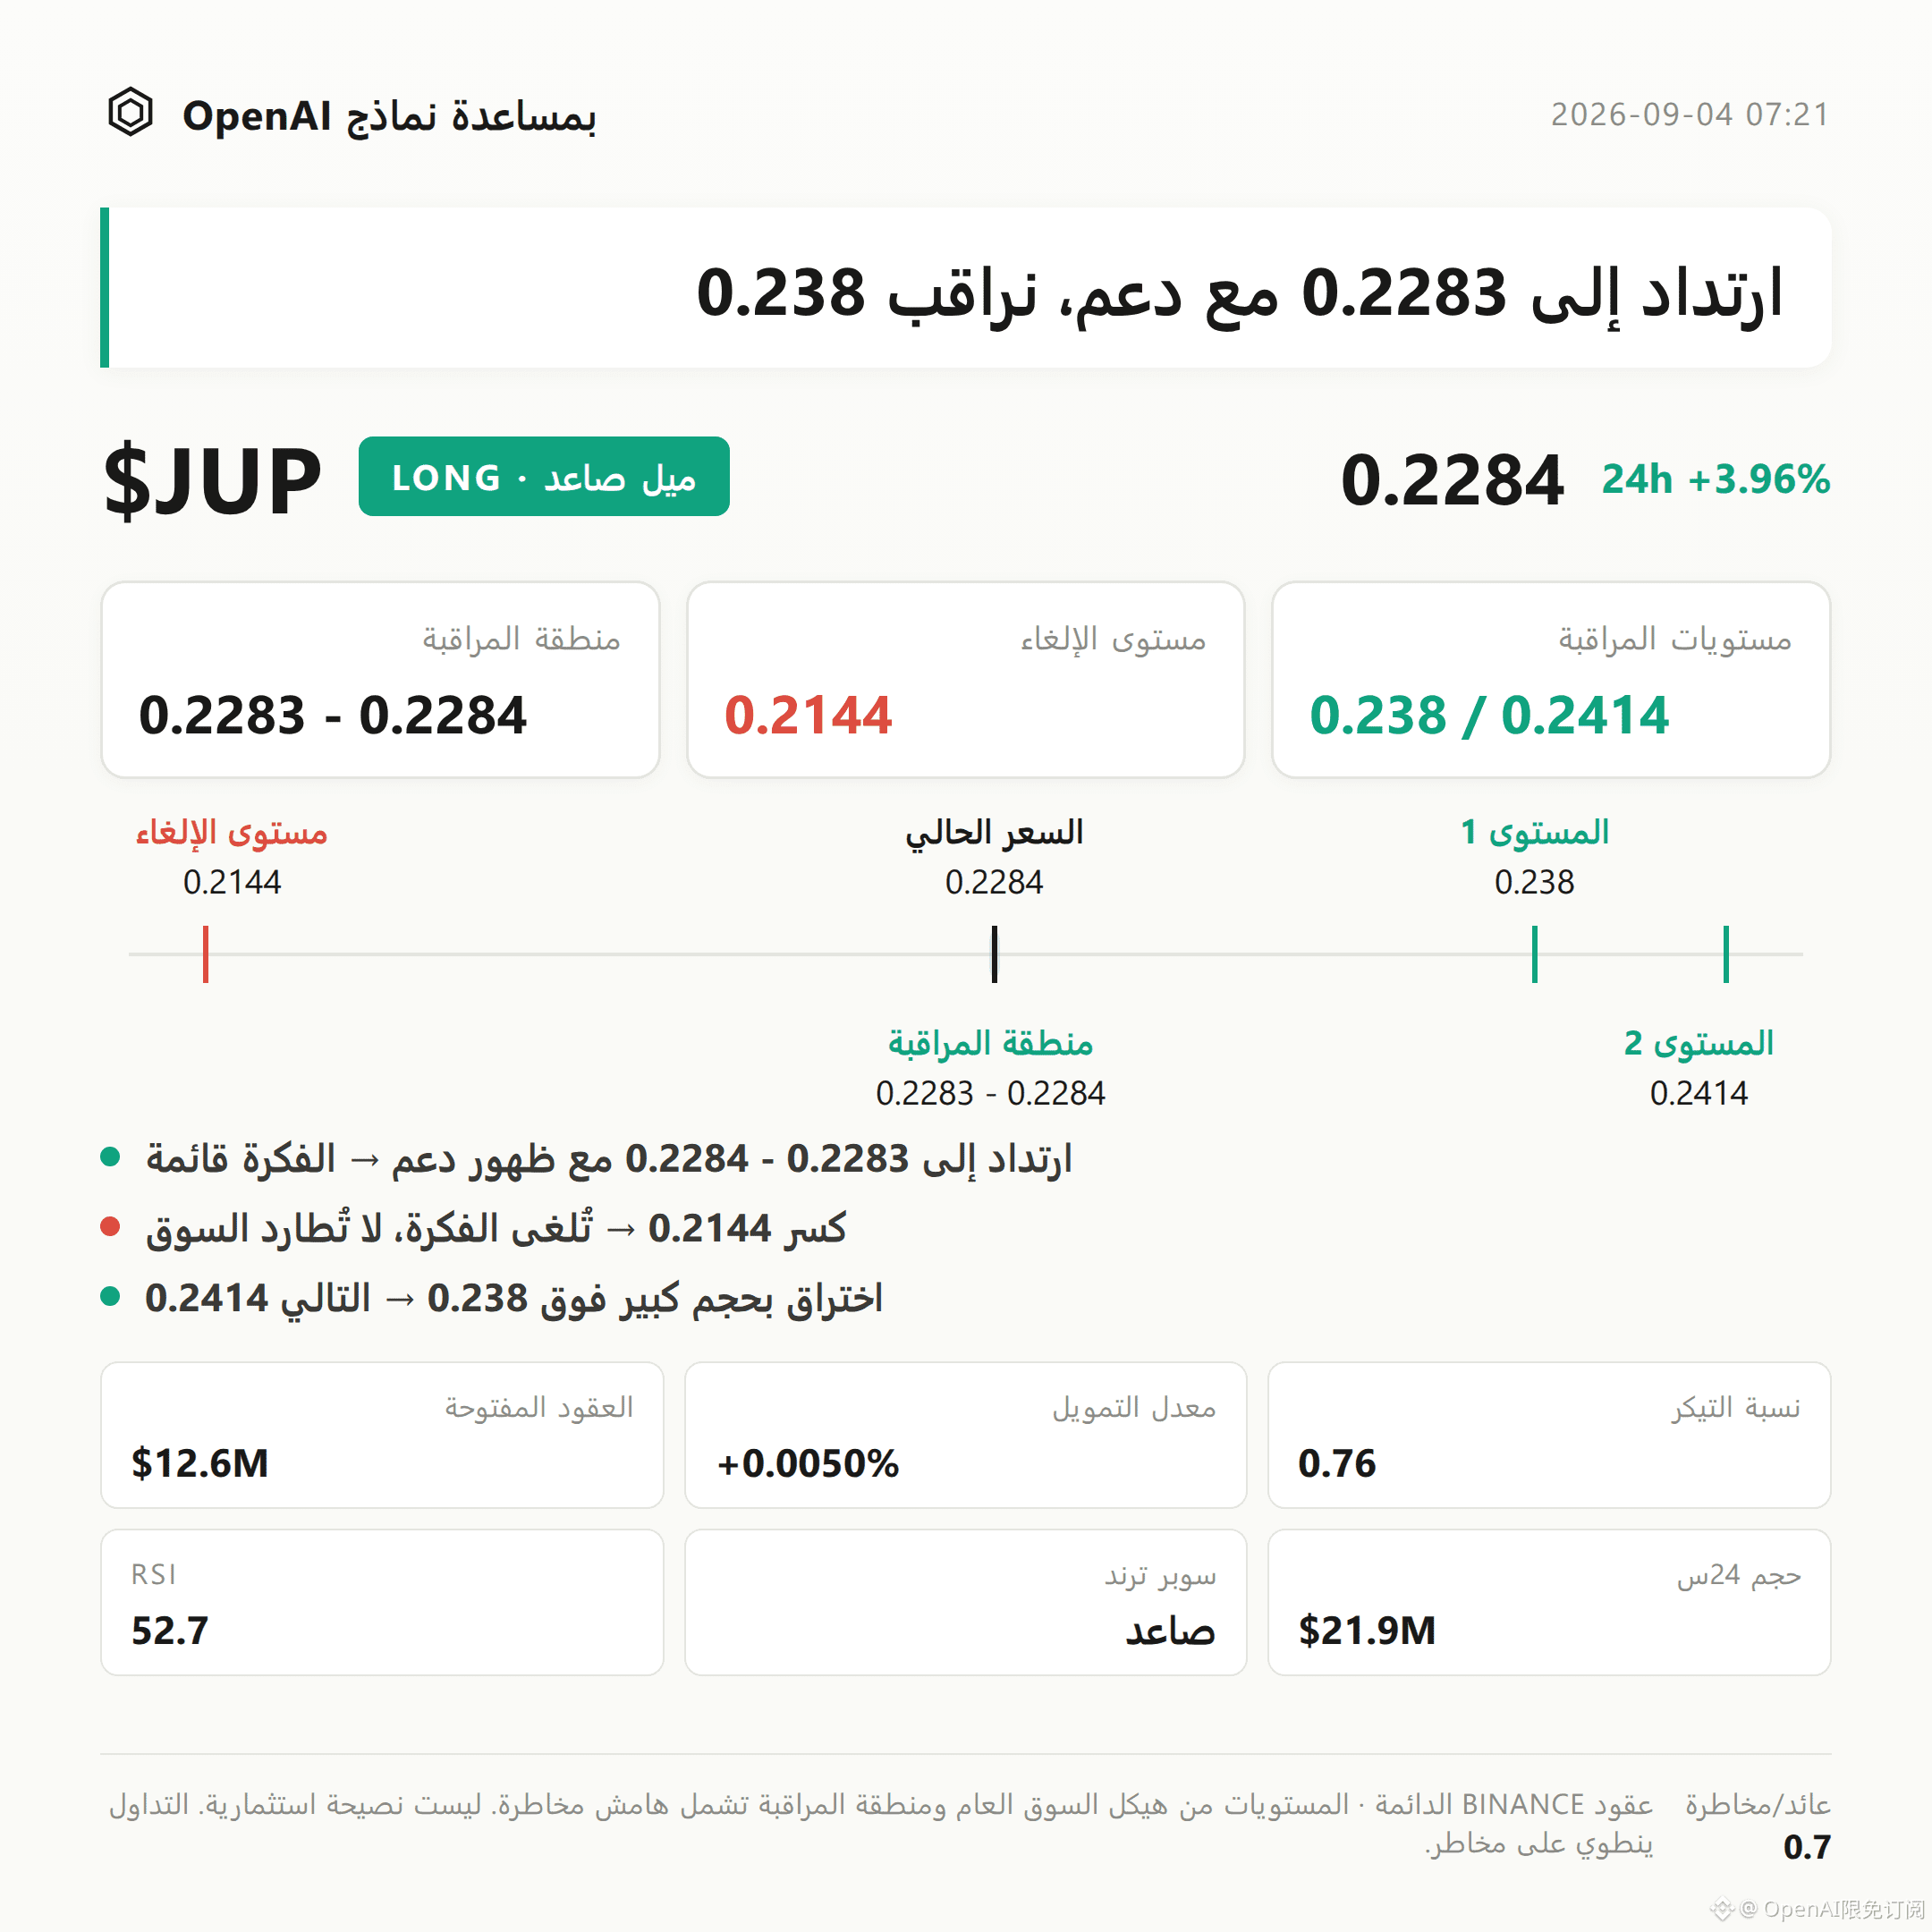
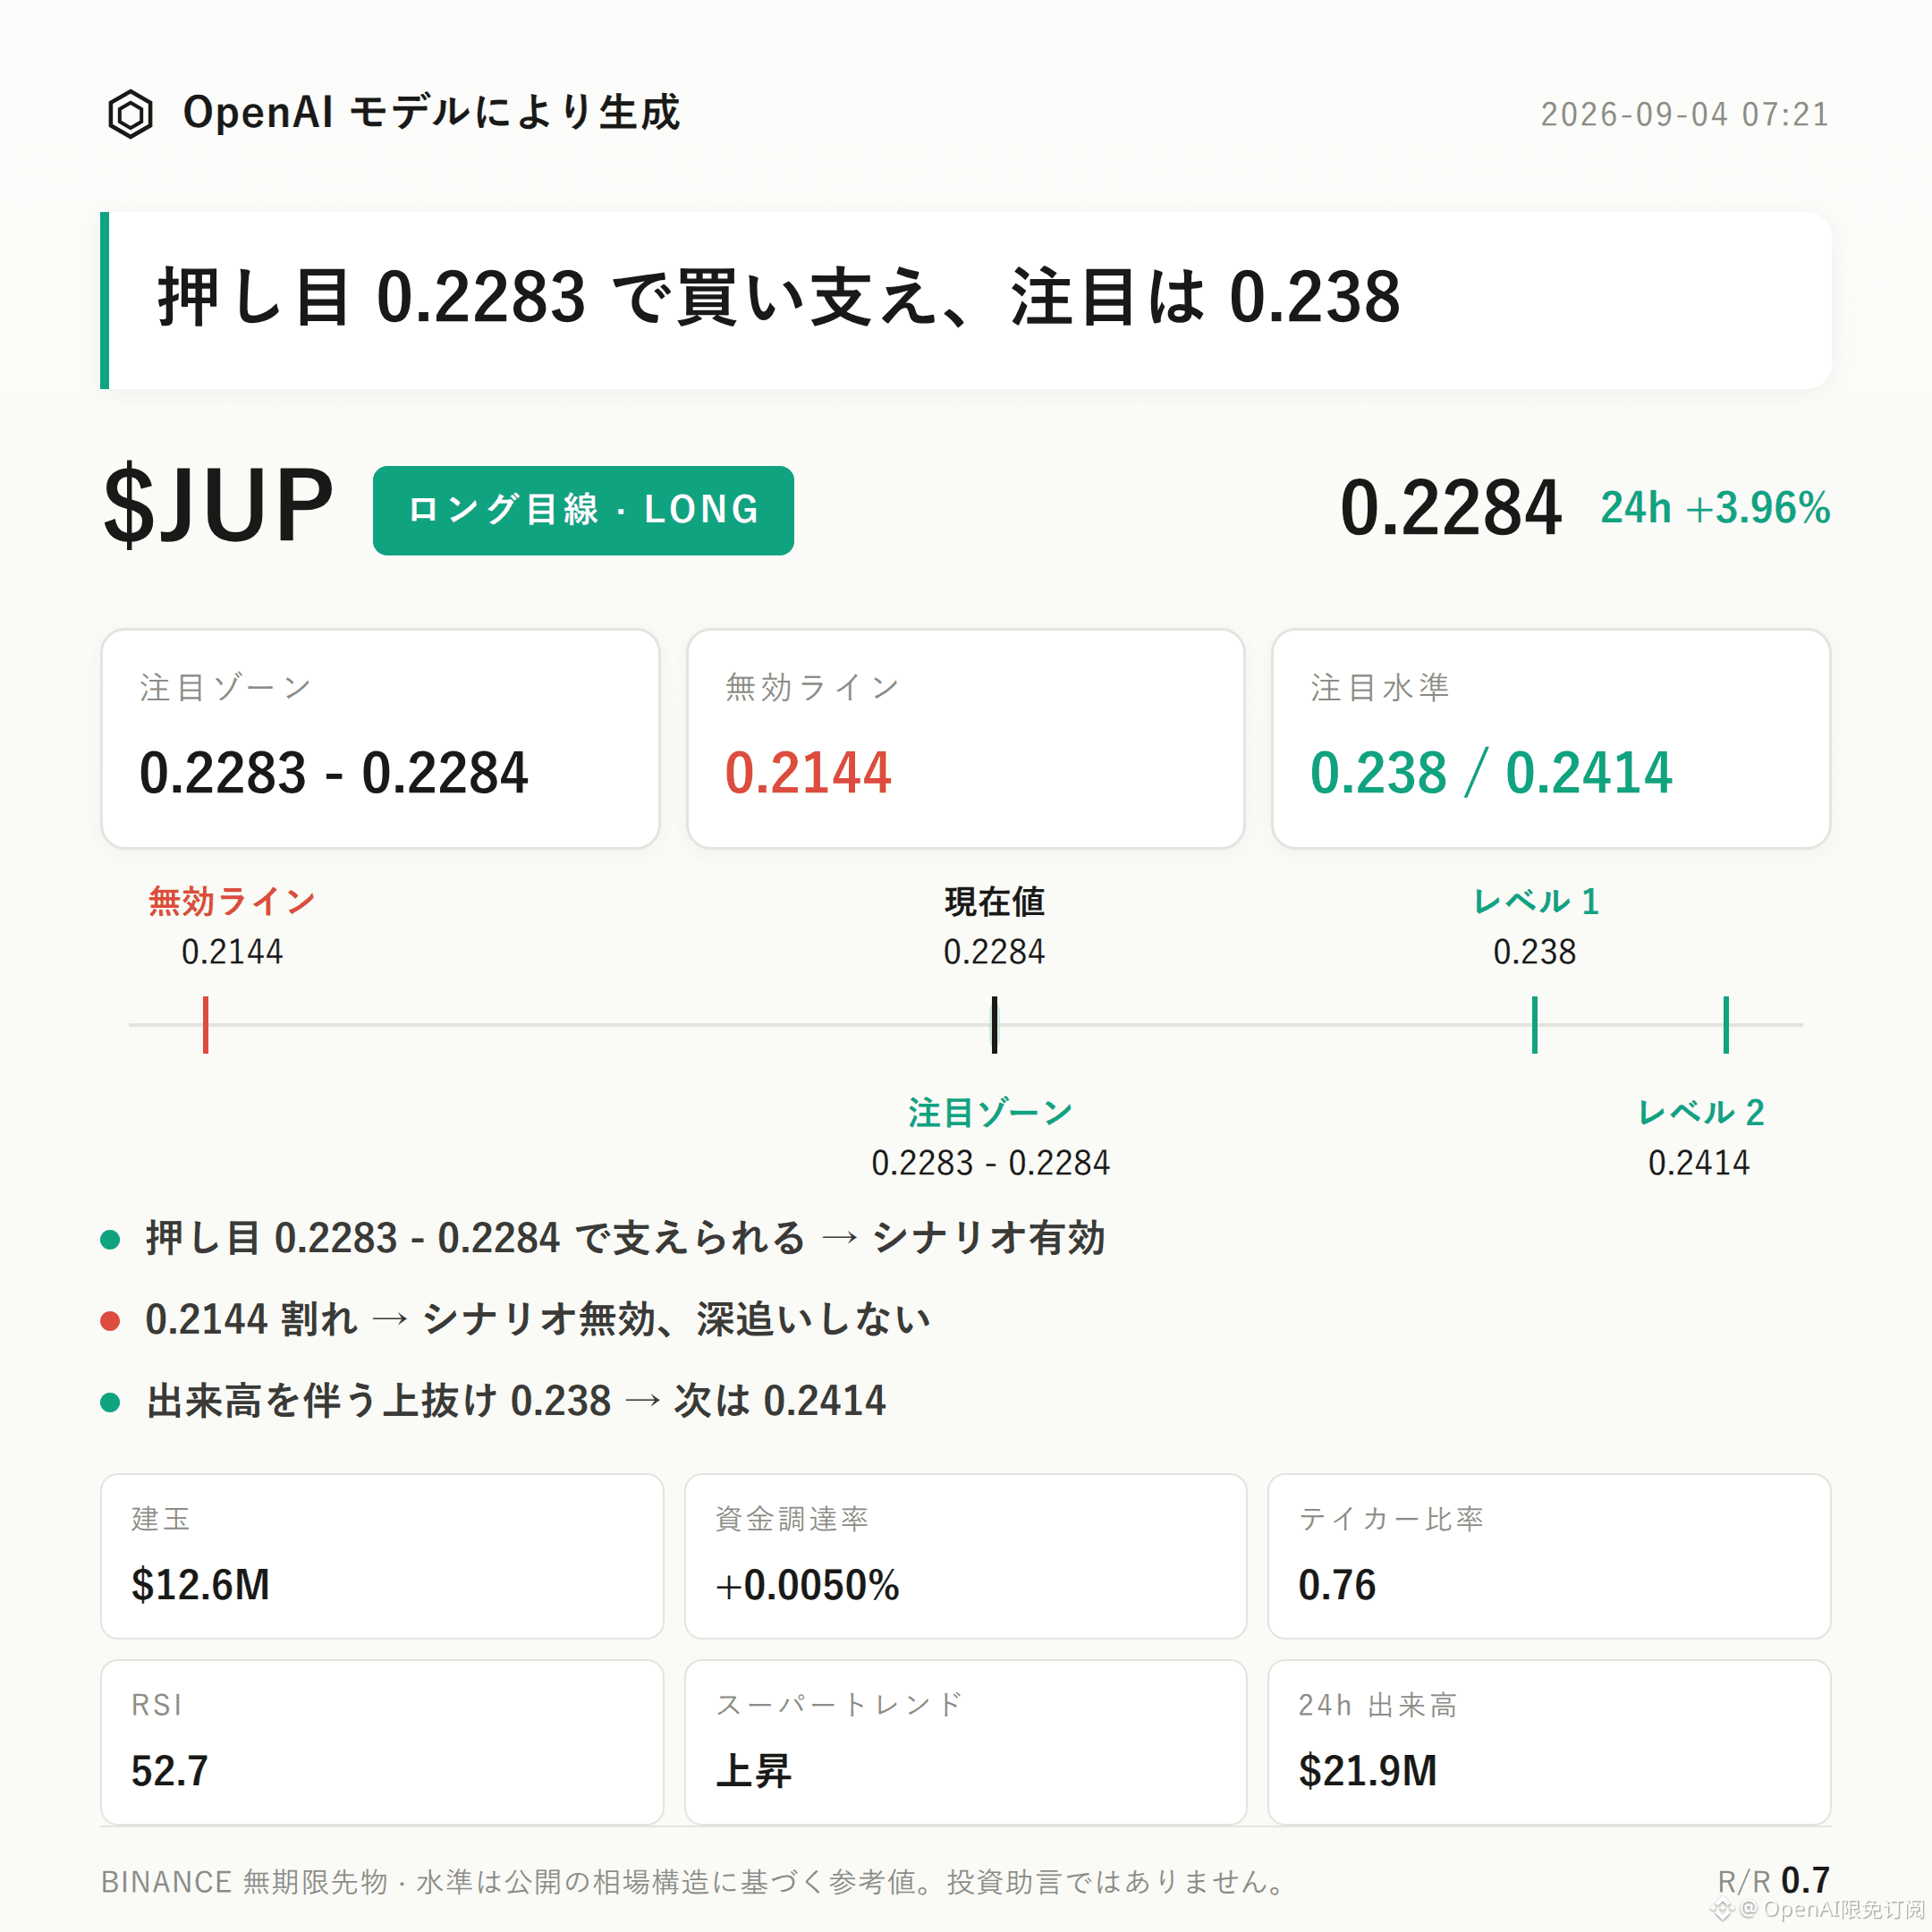
$JUP Bias: Bullish | Focus Zone 0.2283 - 0.2284 | Invalidation Reference 0.2144 | Observation Levels 0.238 / 0.2414
The current structure of $JUP remains bullish.
The Supertrend stays upward, the MACD maintains bullish momentum, open interest in the last 24 hours increased by 7.4%, and all three indicators are aligned in the bullish direction—bulls have the advantage.
The key is to watch whether the bullish focus zone can continue to receive solid support; the stability of that support determines whether this idea can continue.
The recent high is 0.238, the recent low is 0.2144, and the current price 0.2284 is trading in the upper-middle of this range.
The Bollinger Band midline at 0.2283 closely matches the current price; the upper band is 0.2414 and the lower band is 0.2153. Price is sticking near the midline and has not clearly broken out of the central range yet.
RSI is 52.7, sitting in a healthy zone with no obvious overbought pressure.
MACD keeps bullish momentum, and the Supertrend indicator also maintains an upward direction.
Over the past 24 hours, trading volume is $21.90M, and open interest is $12.57M. The 24-hour change is +7.4%, indicating incremental capital participation.
Funding rate is +0.0050%, showing a slight bullish tilt.
In the long/short account ratio, longs account for 56%.
Note: the active buy/sell ratio is 0.76, meaning buy-side strength is not dominant right now—this is a contrarian signal within the current structure, so it should be stated plainly first.
For the bullish focus zone, first look at 0.2283-0.2284. It’s more suitable to wait for confirmation after a pullback and support. If clear support appears in this area, the bullish bias can be considered conditionally valid in the short term.
Set the invalidation reference at 0.2144, i.e., the recent low. If price breaks below this level, it means the current breakout/up-attack structure is damaged and the bullish thesis fails—do not continue relying on it.
For the upside observation level, watch 0.238 (the recent high). If there is a volume-backed upside breakout and continuation, then consider the resistance around 0.2414, which corresponds to the Bollinger upper band.
Reversal risks must be disclosed proactively: an active buy/sell ratio of 0.76 suggests that the buy side is not dominant. This somewhat diverges from the signals of rising open interest and a positive funding rate. Directional judgment should be revisited alongside subsequent volume/energy changes; you can’t rely on a single indicator alone.
The risk-reward ratio is 0.7, which is on the low side—overall the setup’s payoff is limited.
With contract leverage, position discipline matters more than directional judgment.
Position note: This account holds a long position of $FOGO in the live market. As long as the logic isn’t broken, the position can be held.
For reference only and not investment advice. Contracts involve leverage; investing has risk.
This article is generated with the assistance of an OpenAI model.
$JUP
#Contract Analysis
$JUP Bias: Bullish | Focus Zone 0.2283 - 0.2284 | Invalidation Reference 0.2144 | Observation Levels 0.238 / 0.2414
The current structure of $JUP remains bullish.
The Supertrend stays upward, the MACD maintains bullish momentum, open interest in the last 24 hours increased by 7.4%, and all three indicators are aligned in the bullish direction—bulls have the advantage.
The key is to watch whether the bullish focus zone can continue to receive solid support; the stability of that support determines whether this idea can continue.
The recent high is 0.238, the recent low is 0.2144, and the current price 0.2284 is trading in the upper-middle of this range.
The Bollinger Band midline at 0.2283 closely matches the current price; the upper band is 0.2414 and the lower band is 0.2153. Price is sticking near the midline and has not clearly broken out of the central range yet.
RSI is 52.7, sitting in a healthy zone with no obvious overbought pressure.
MACD keeps bullish momentum, and the Supertrend indicator also maintains an upward direction.
Over the past 24 hours, trading volume is $21.90M, and open interest is $12.57M. The 24-hour change is +7.4%, indicating incremental capital participation.
Funding rate is +0.0050%, showing a slight bullish tilt.
In the long/short account ratio, longs account for 56%.
Note: the active buy/sell ratio is 0.76, meaning buy-side strength is not dominant right now—this is a contrarian signal within the current structure, so it should be stated plainly first.
For the bullish focus zone, first look at 0.2283-0.2284. It’s more suitable to wait for confirmation after a pullback and support. If clear support appears in this area, the bullish bias can be considered conditionally valid in the short term.
Set the invalidation reference at 0.2144, i.e., the recent low. If price breaks below this level, it means the current breakout/up-attack structure is damaged and the bullish thesis fails—do not continue relying on it.
For the upside observation level, watch 0.238 (the recent high). If there is a volume-backed upside breakout and continuation, then consider the resistance around 0.2414, which corresponds to the Bollinger upper band.
Reversal risks must be disclosed proactively: an active buy/sell ratio of 0.76 suggests that the buy side is not dominant. This somewhat diverges from the signals of rising open interest and a positive funding rate. Directional judgment should be revisited alongside subsequent volume/energy changes; you can’t rely on a single indicator alone.
The risk-reward ratio is 0.7, which is on the low side—overall the setup’s payoff is limited.
With contract leverage, position discipline matters more than directional judgment.
Position note: This account holds a long position of $FOGO in the live market. As long as the logic isn’t broken, the position can be held.
For reference only and not investment advice. Contracts involve leverage; investing has risk.
This article is generated with the assistance of an OpenAI model.
$JUP
#Contract Analysis