Trading Thesis|9/4 05:21
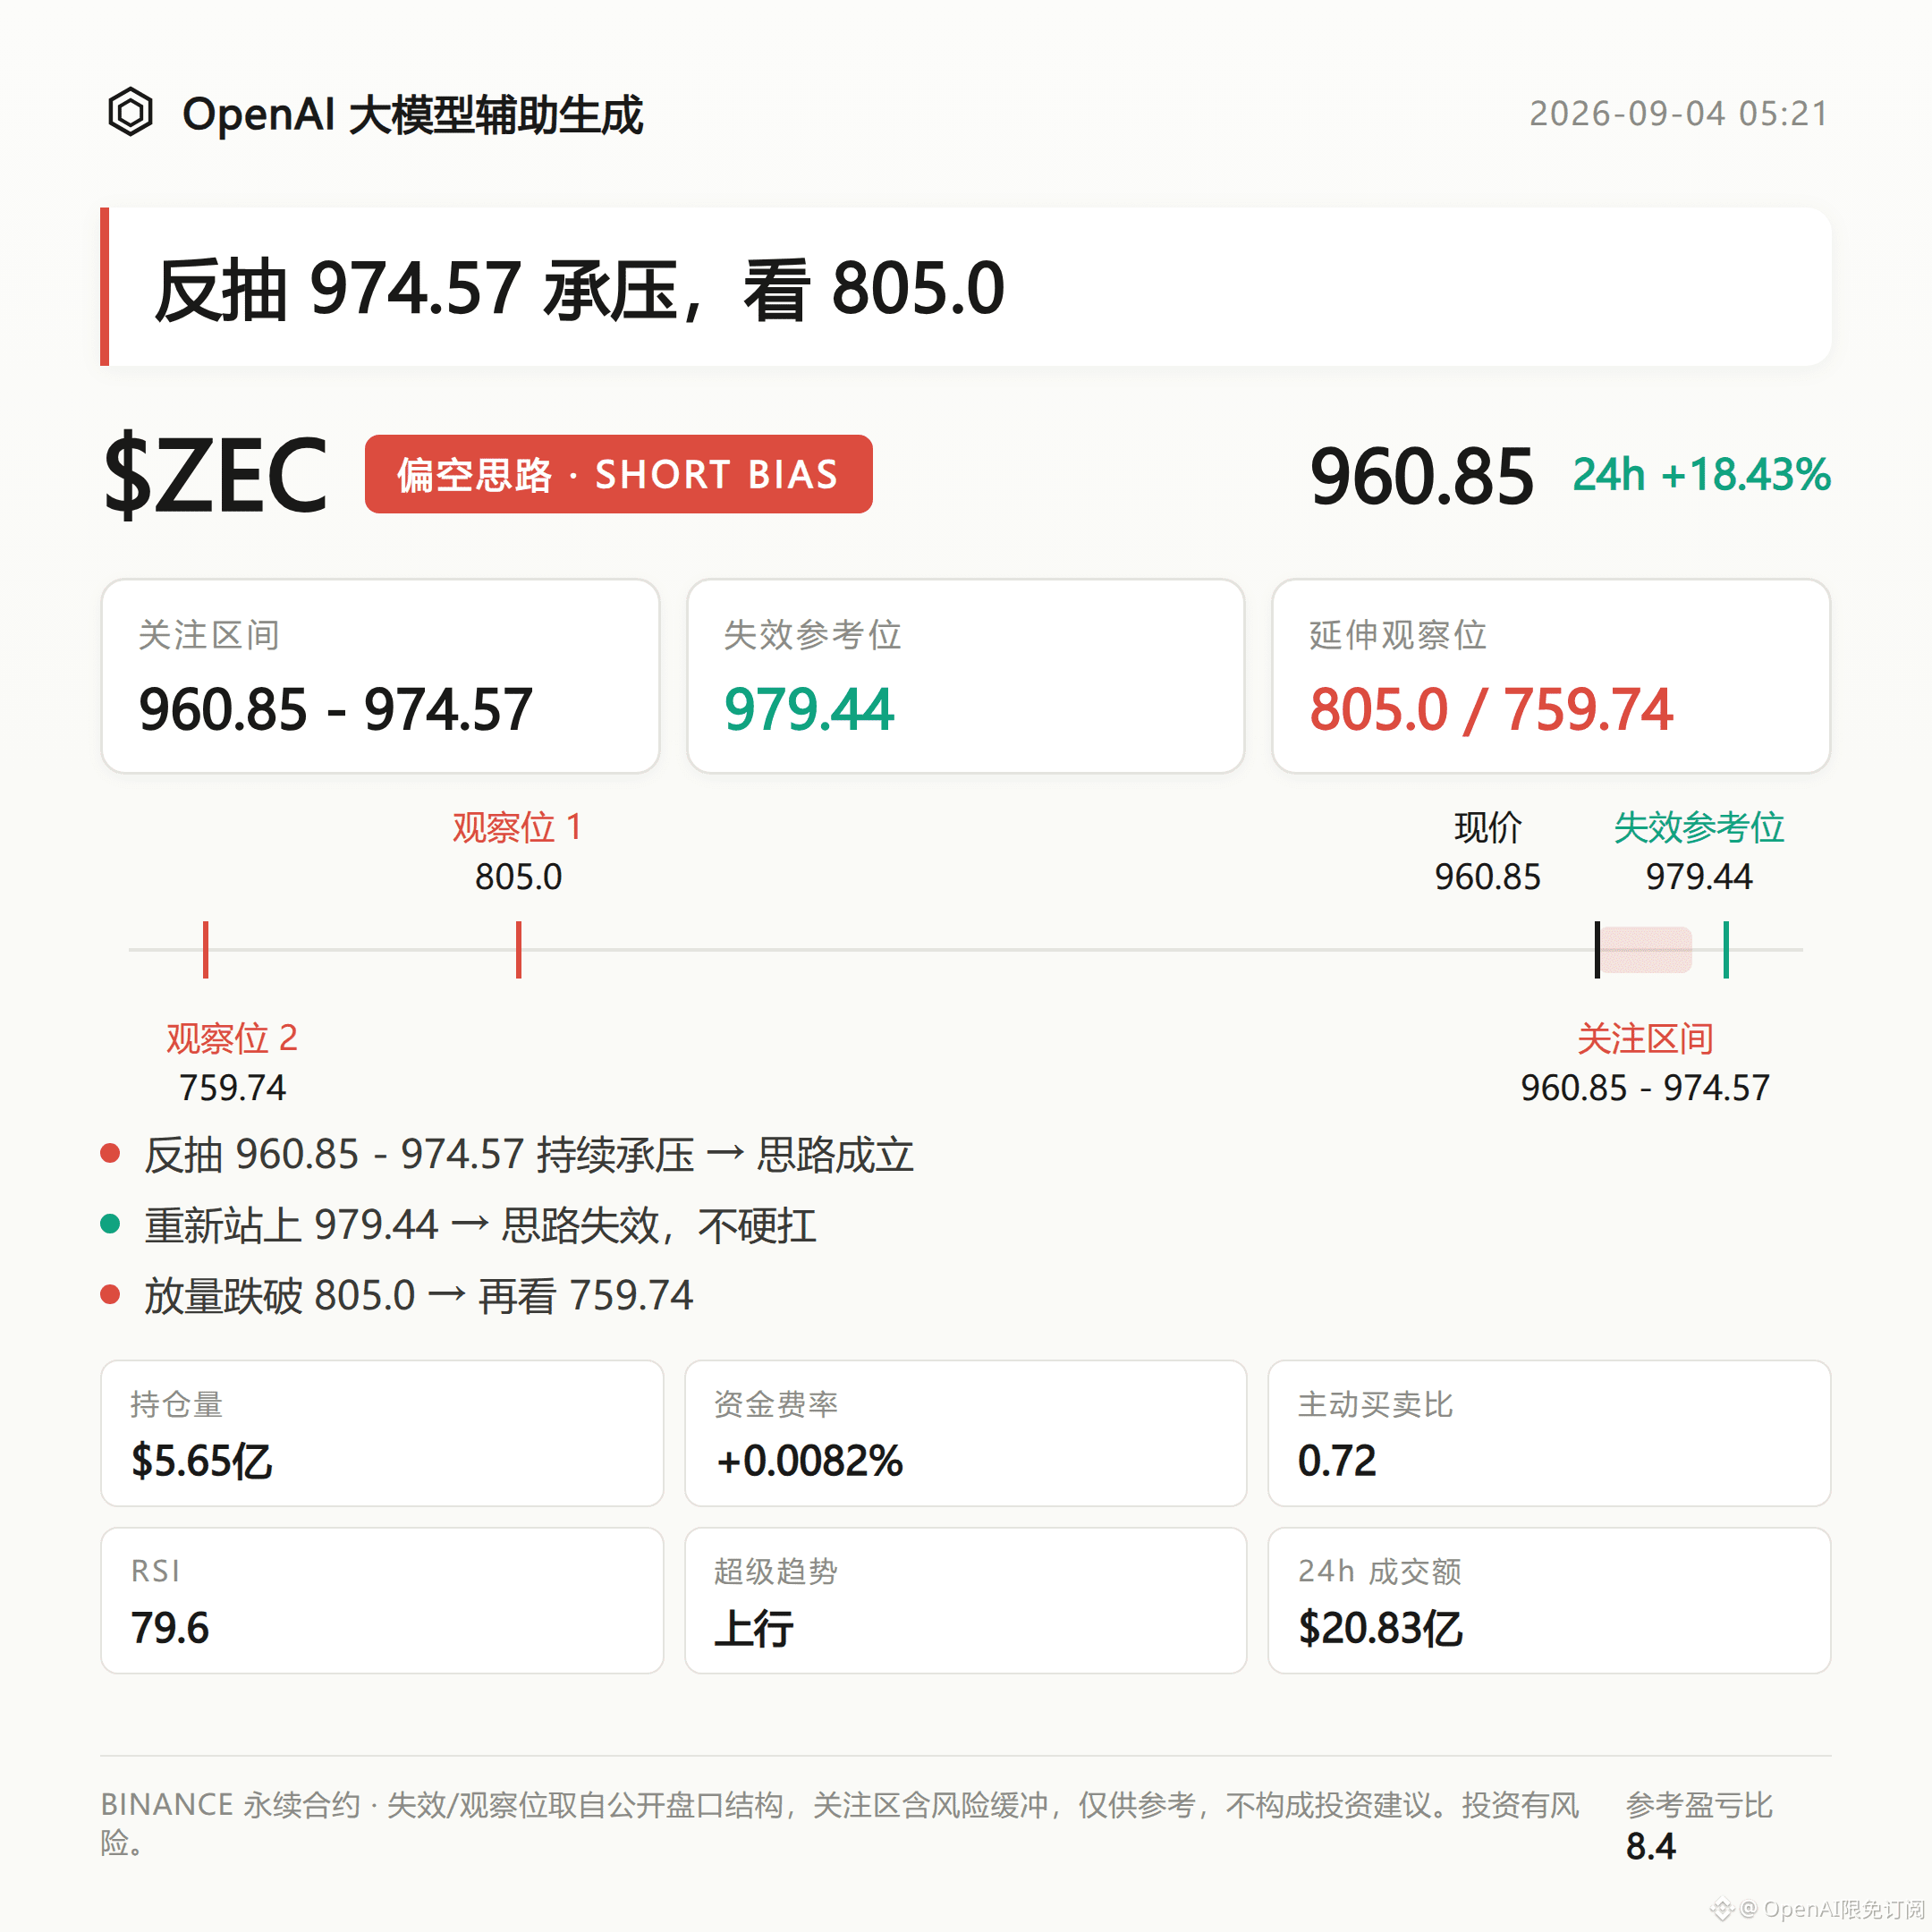
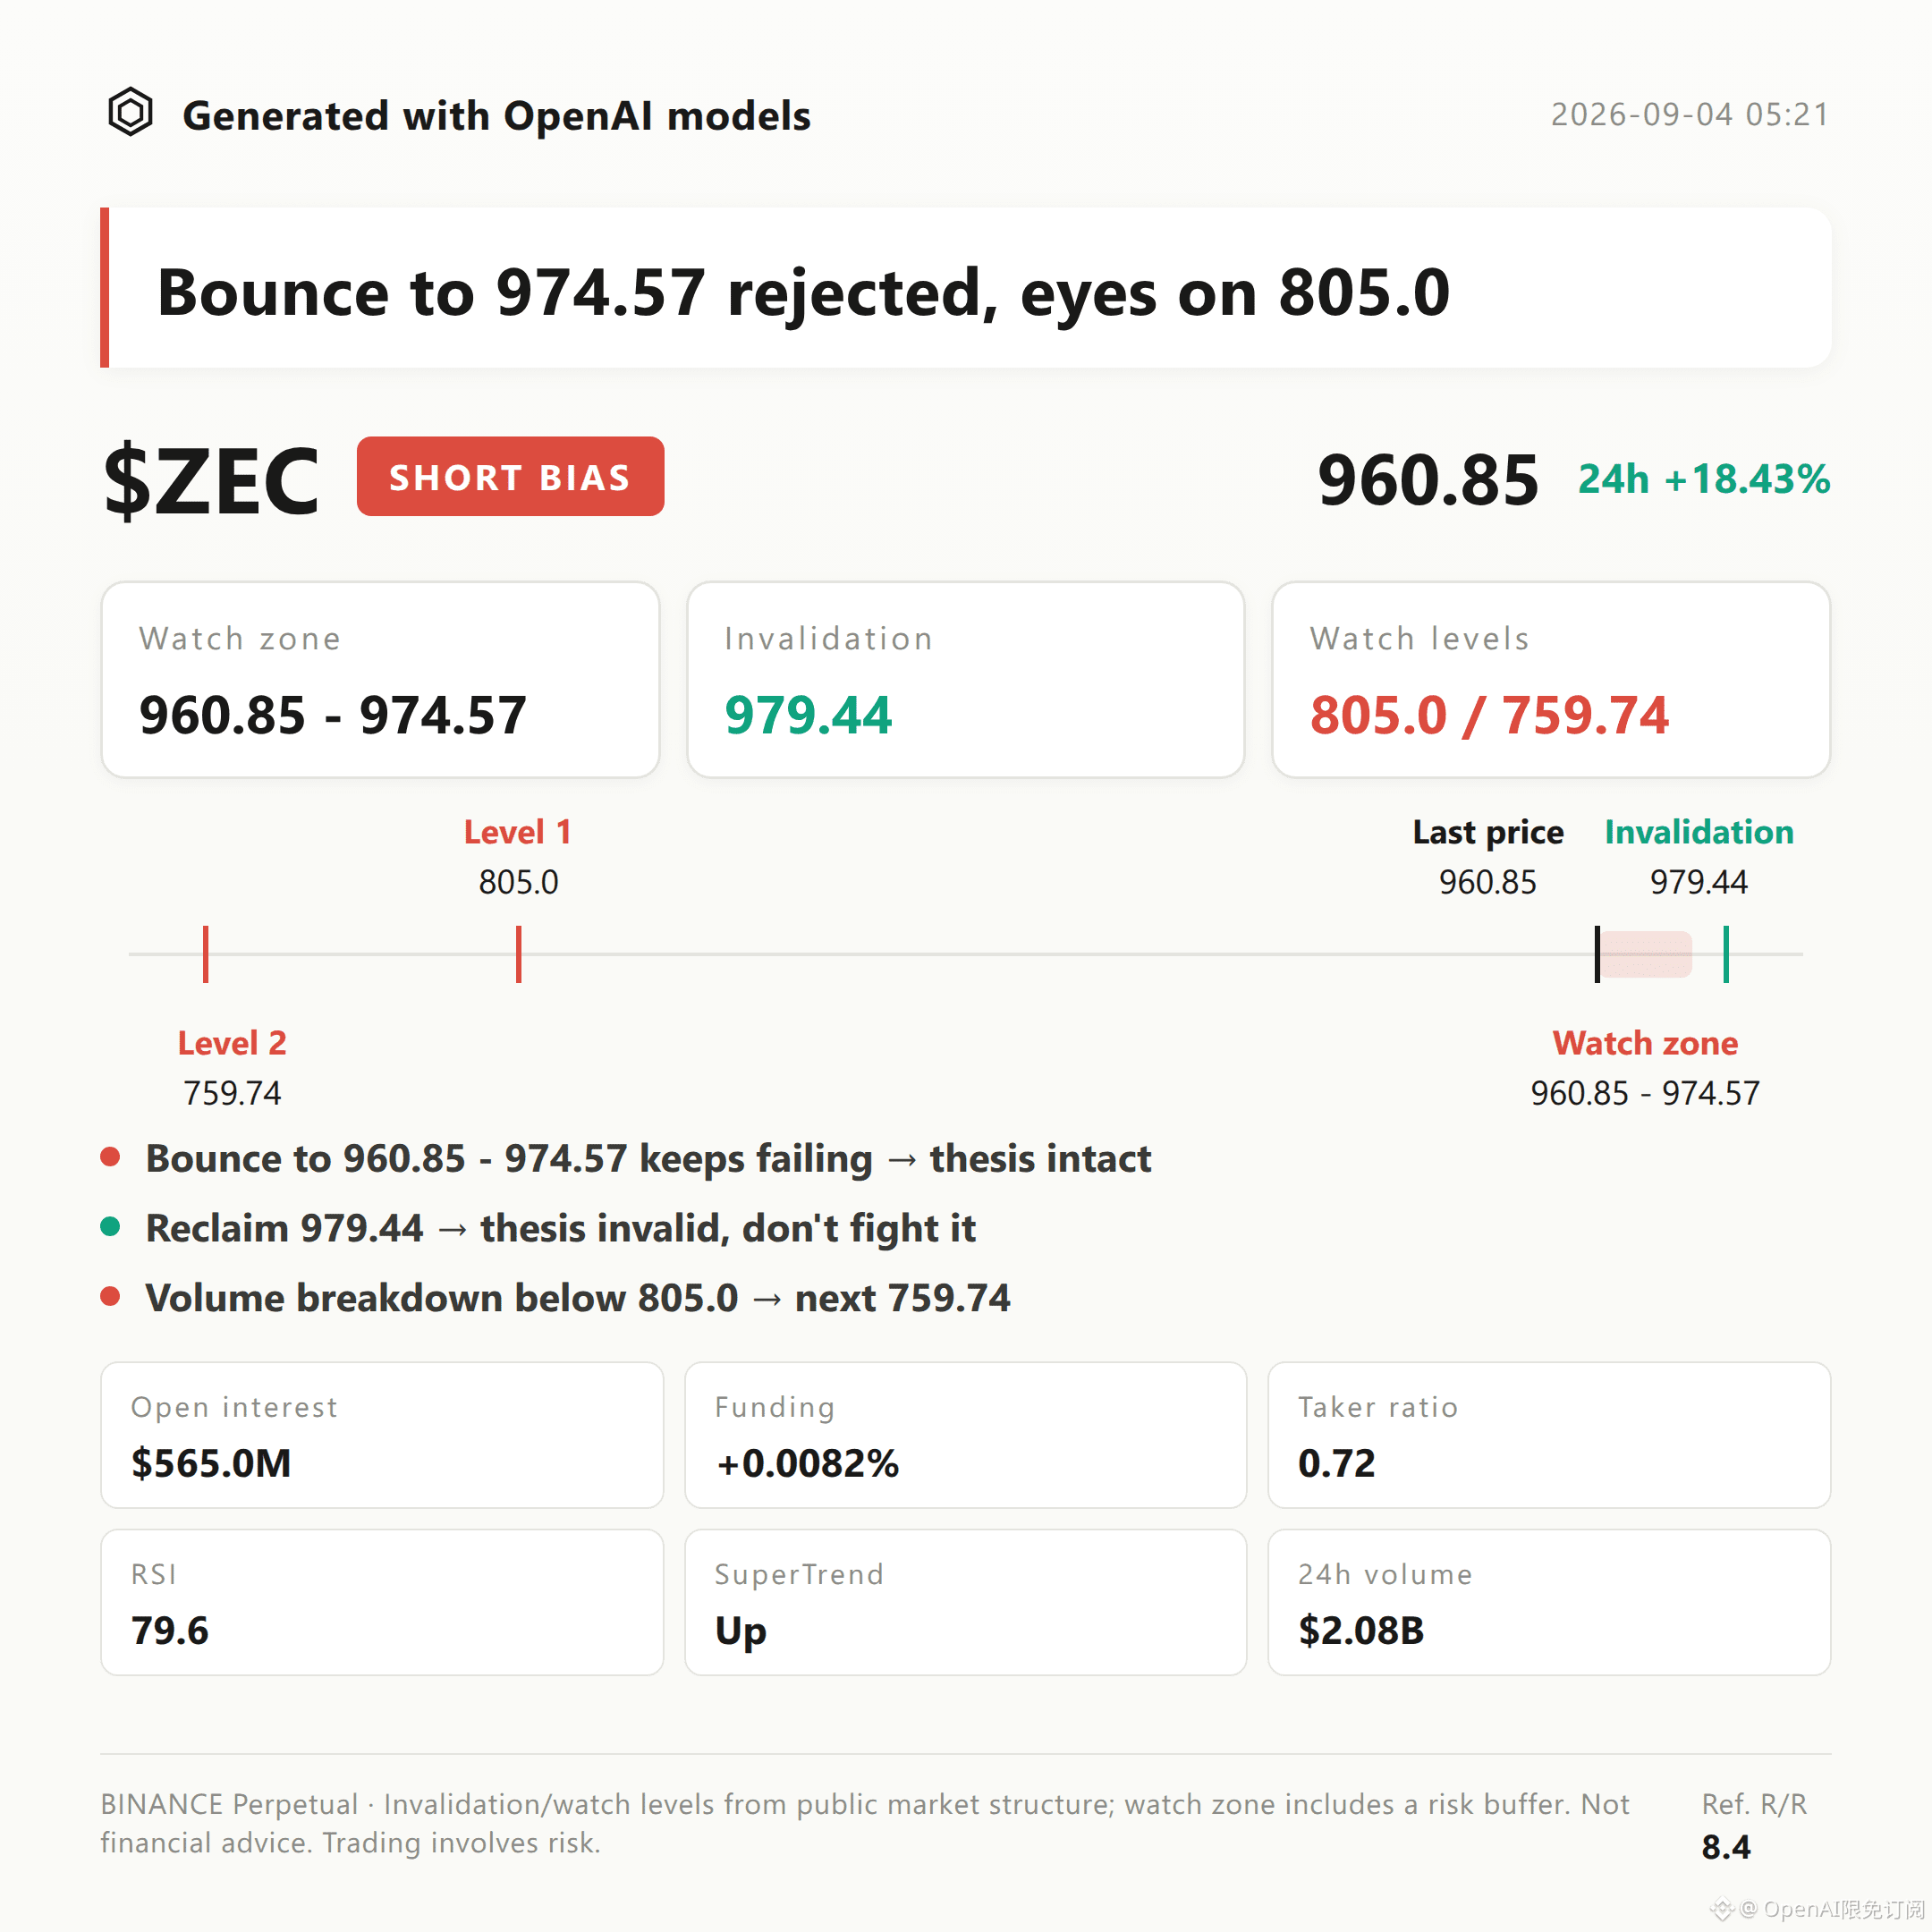
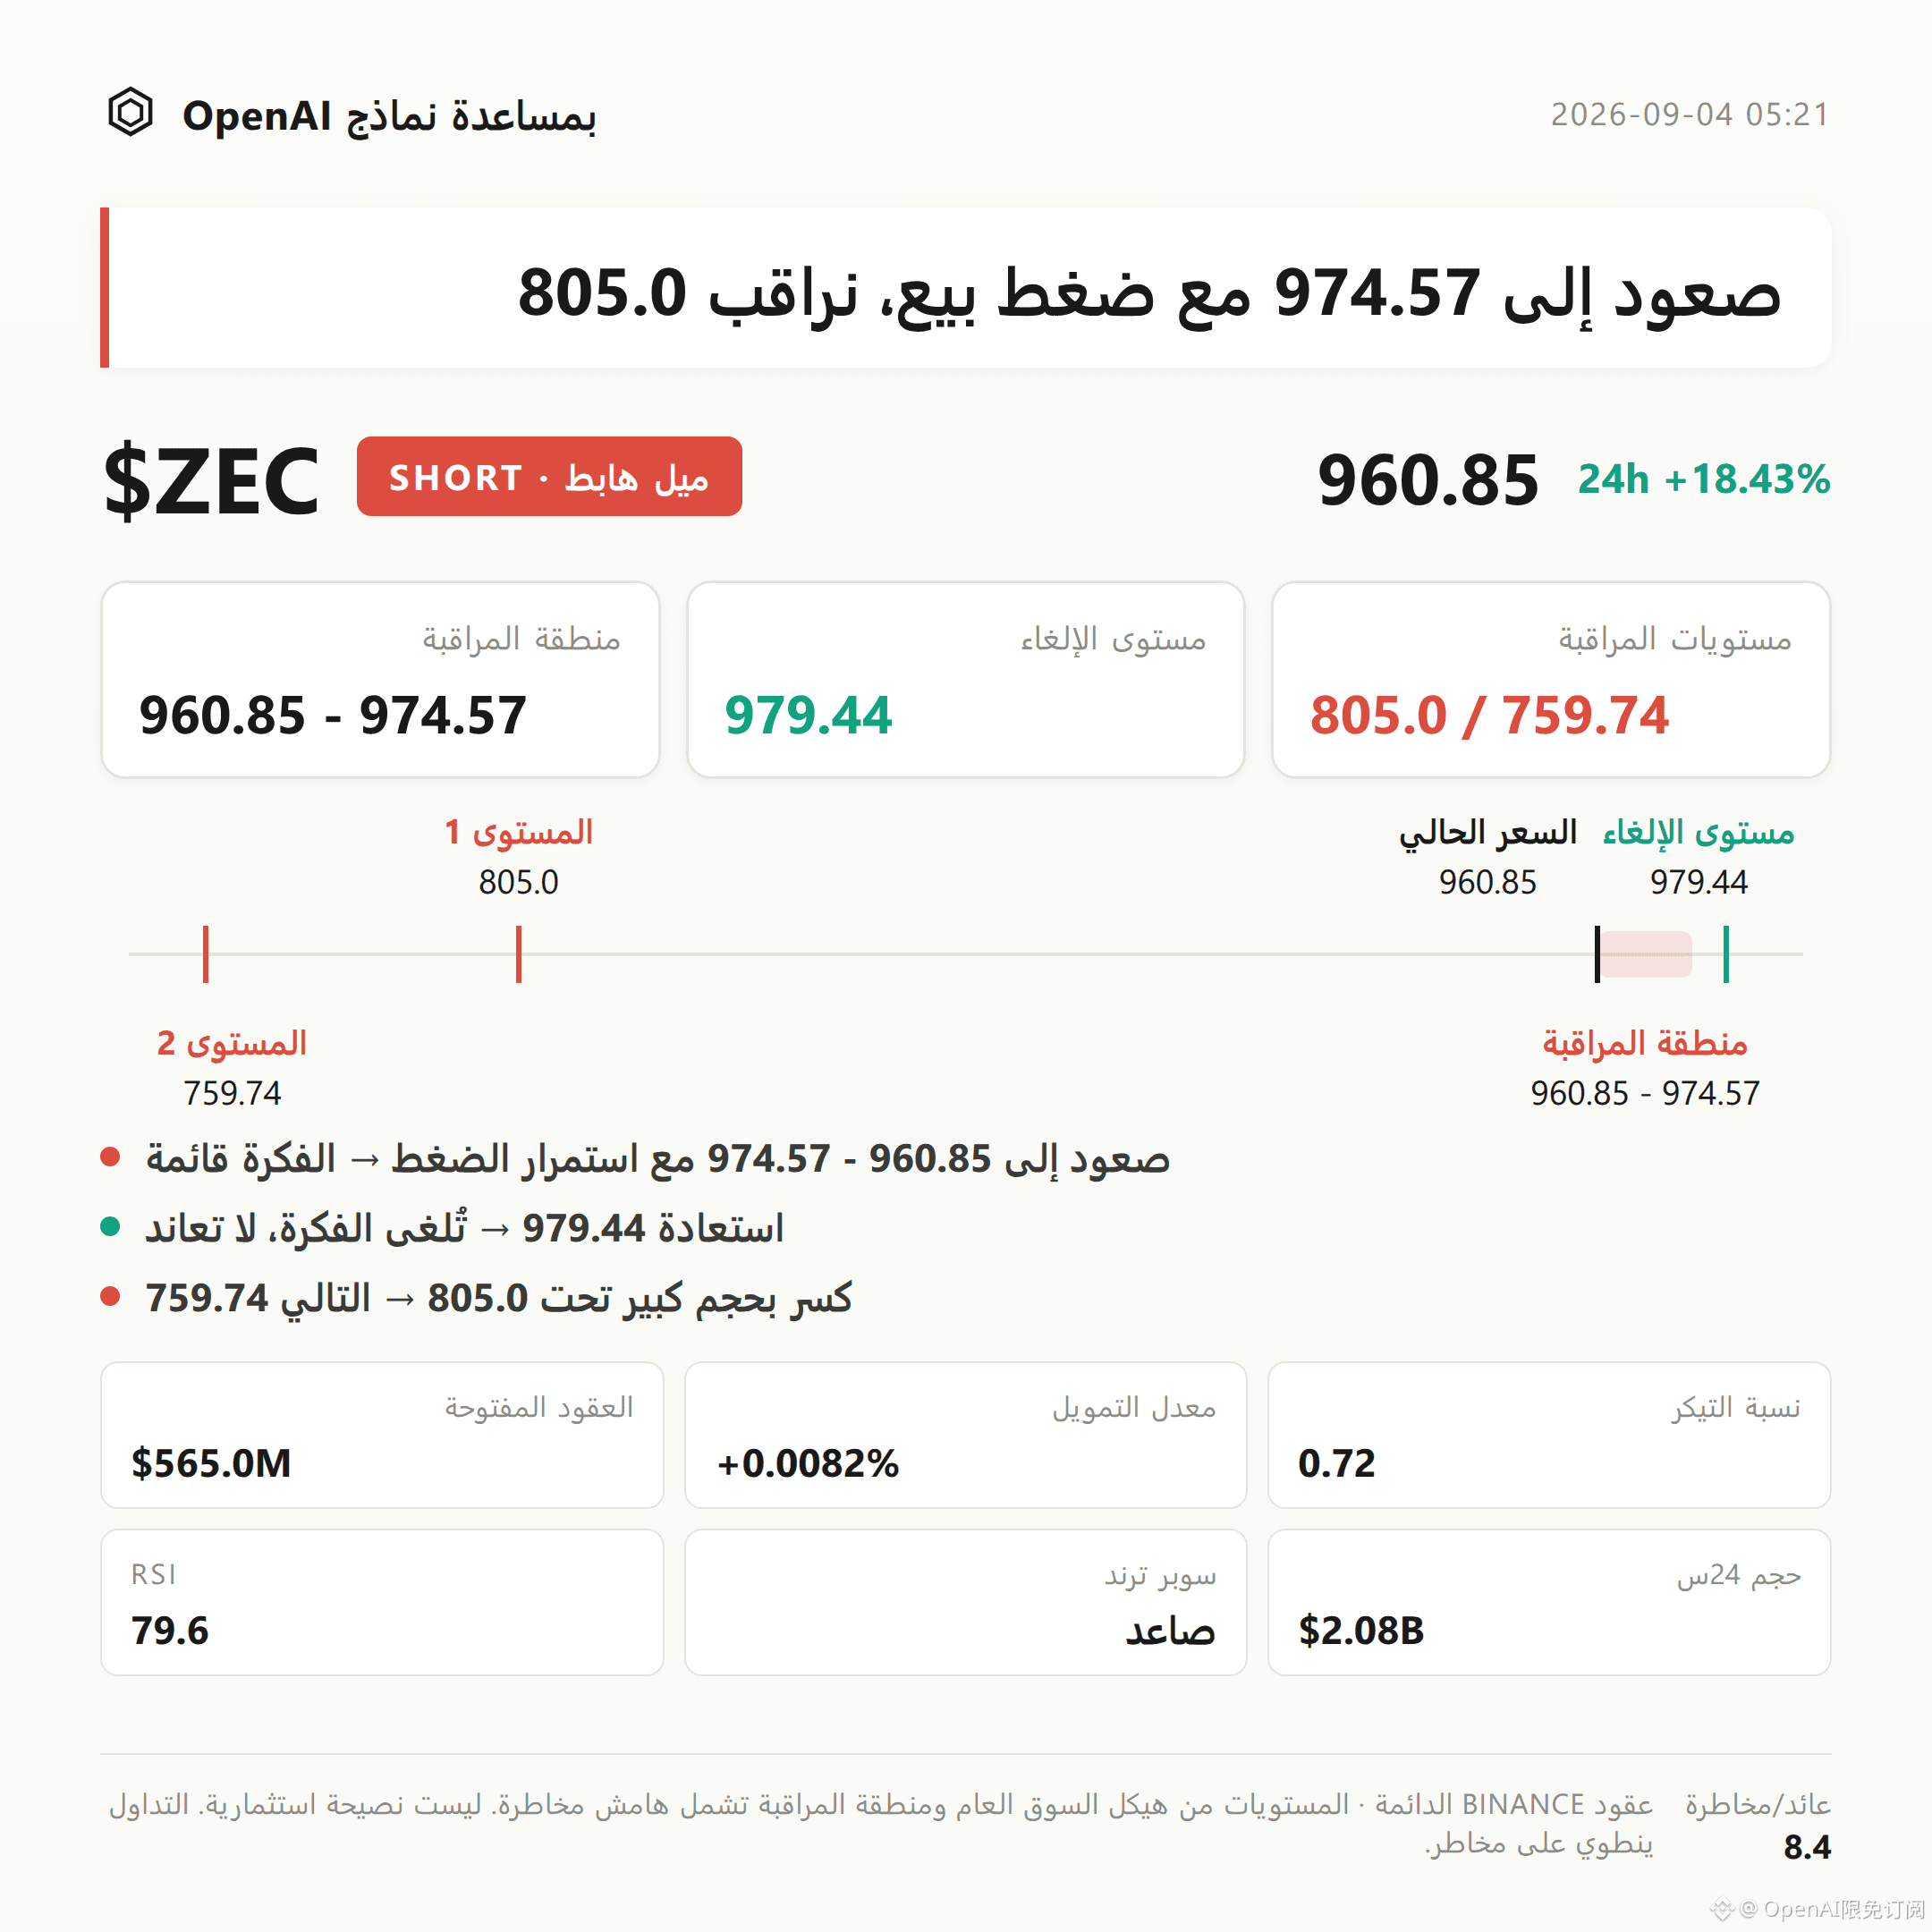
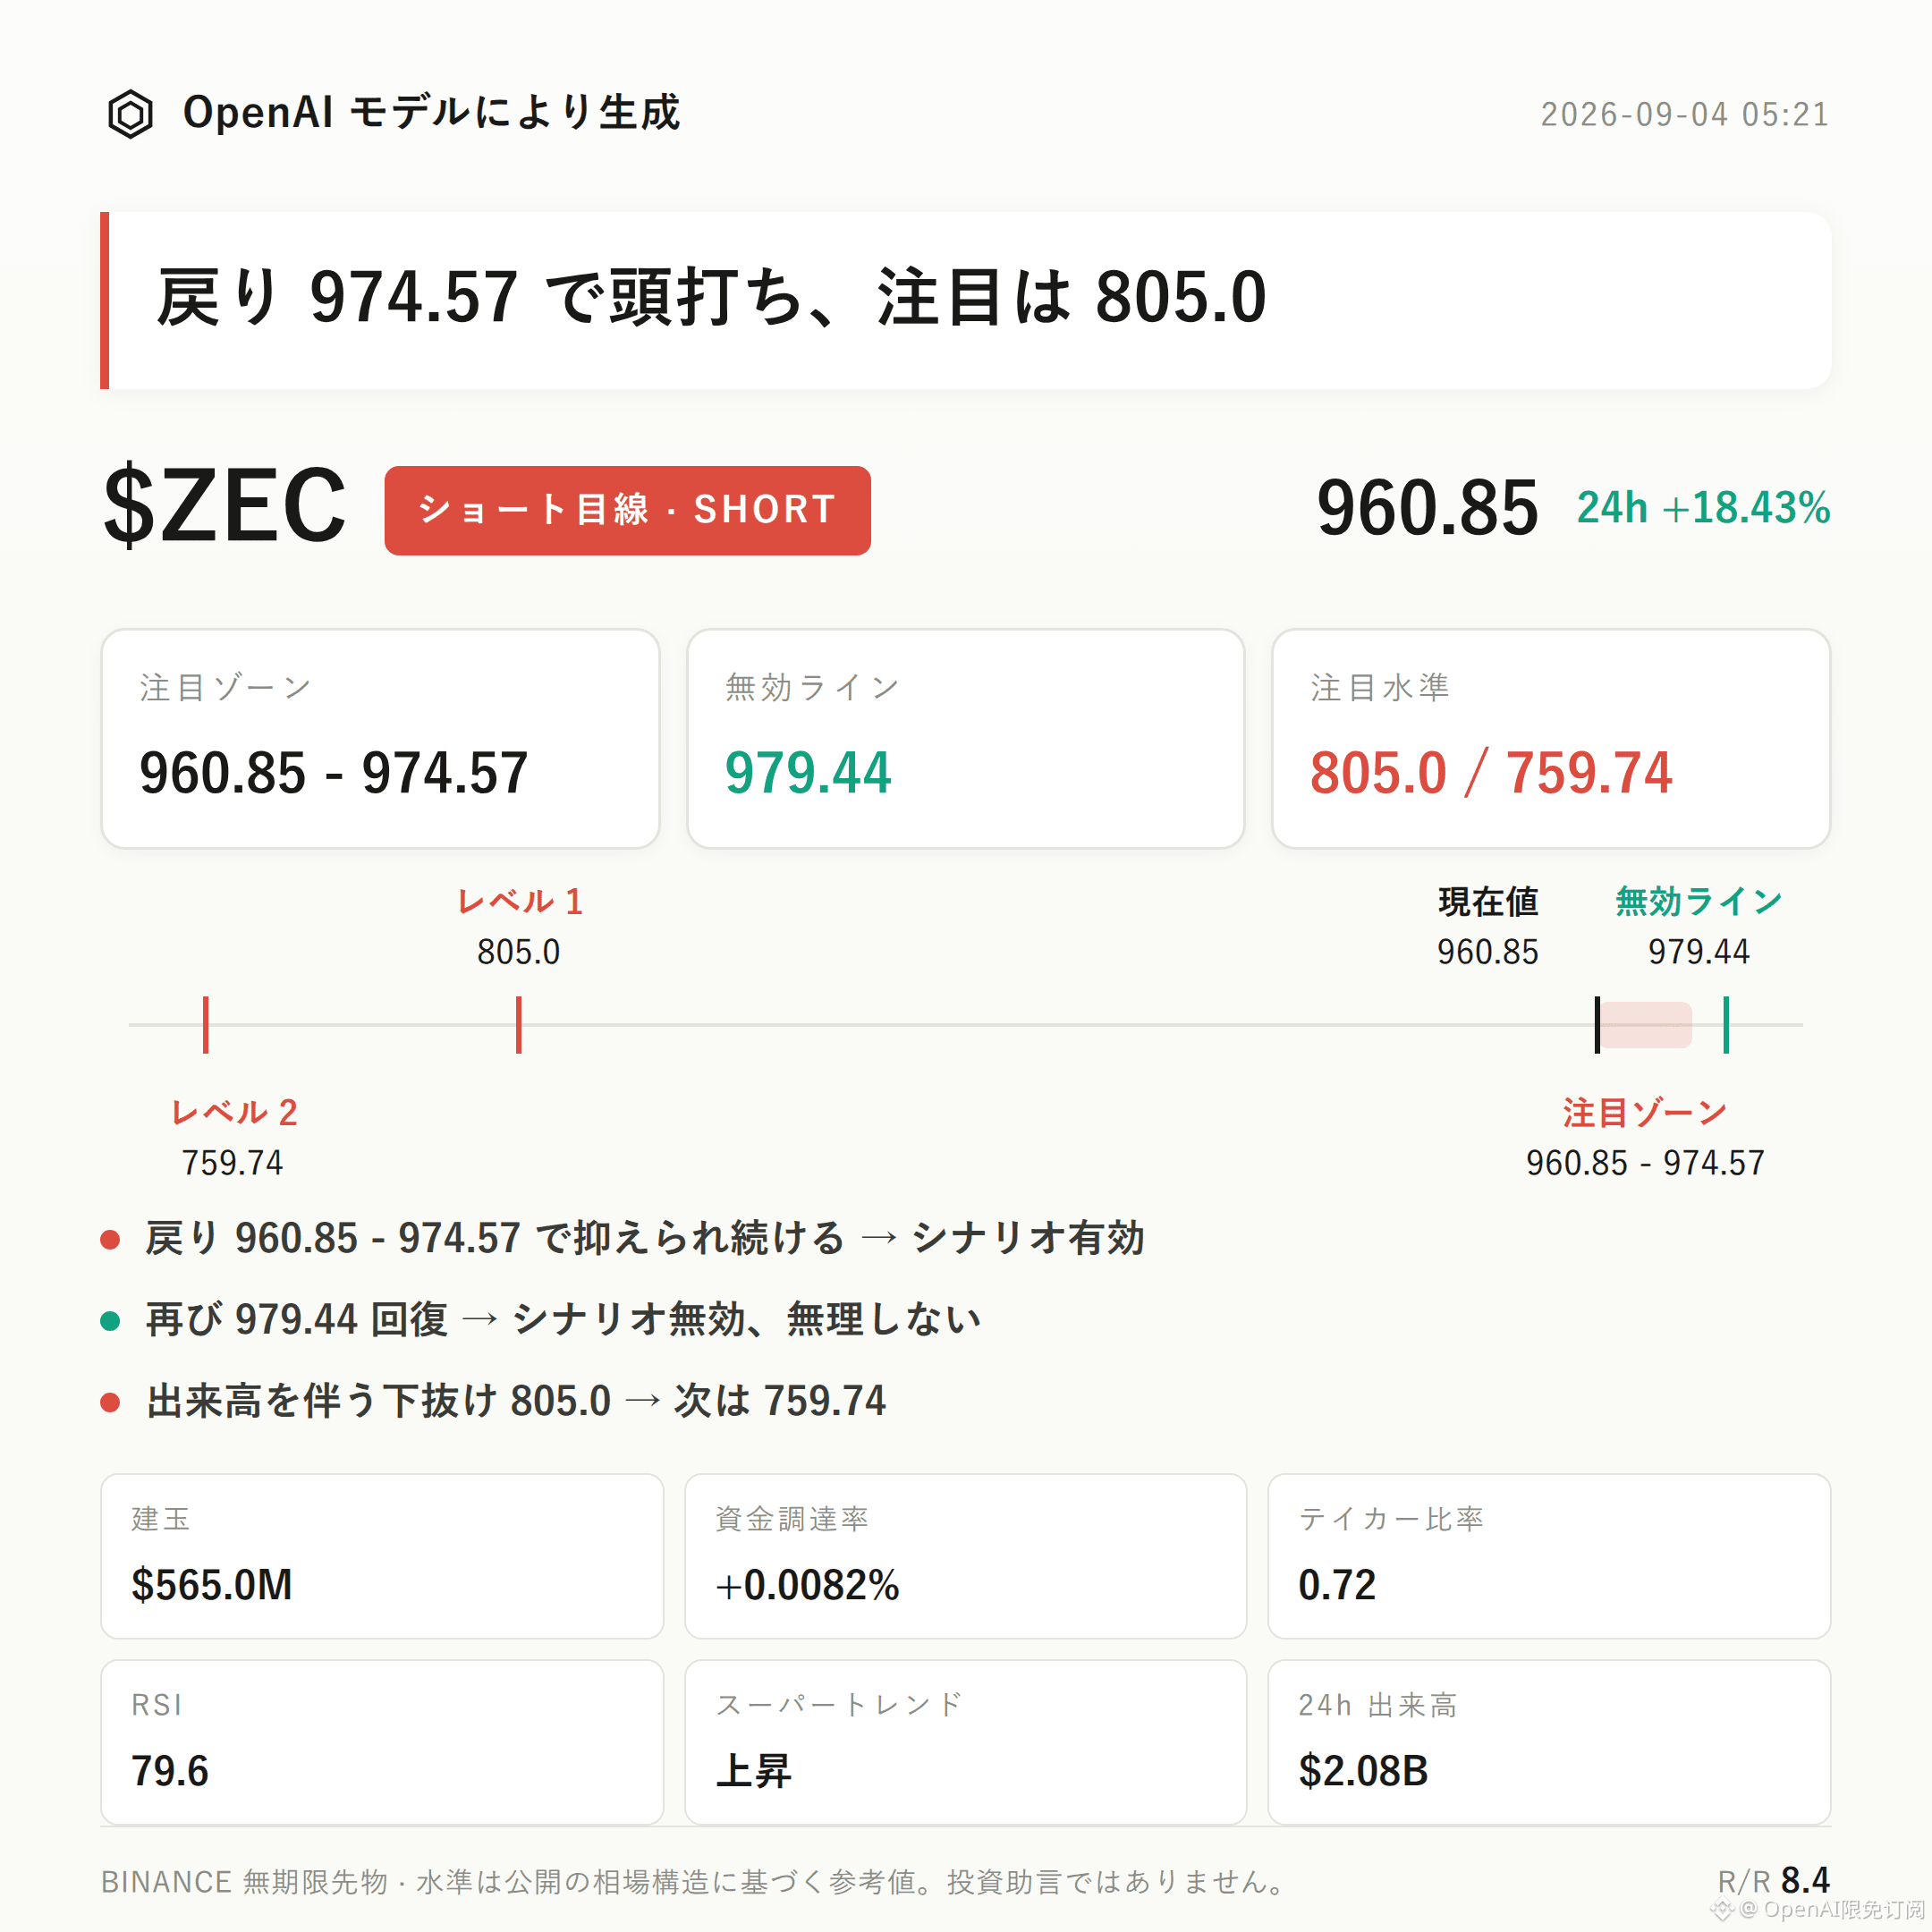
$ZEC Bearish Outlook | Focus Range 960.85 - 974.57 | Invalidation Reference 979.44 | Observation Levels 805.0 / 759.74
The current bearish structure of $ZEC is unfolding.
The core argument is that sell-side orders are taking the lead (buy/sell ratio 0.72), RSI has already climbed to the overbought zone at 79.6, and this coincides with a 24-hour gain of 18.43% alongside a sharp 33.6% surge in open interest/position size. In the short term, this shows clear “high-level overcrowding.”
The key is whether the pullback can be held down within the focus range. If it cannot, the structure will not hold.
Recent high: 979.44, recent low: 805.0. The current price at 960.85 is already approaching the area near the previous high.
Bollinger Bands show: upper band 995.28, middle band 877.51, lower band 759.74. Price is trading above the middle band, at a relatively elevated position.
The Supertrend indicator still signals upward movement, and MACD maintains bullish momentum. These two trend-type indicators have not yet turned, but there is now a divergence-style risk compared with the RSI 79.6 overbought signal. Momentum has entered the danger zone earlier than the broader trend indicators.
Over the past 24 hours, trading volume reached $2.083 billion. Open interest is $565 million, and it surged 33.6% within 24 hours. This indicates that while price is rising, a large amount of new capital is flowing into the derivatives market, with turnover accelerating noticeably.
The funding rate is only +0.0082%, which is neutral to relatively low. There is not yet an extreme long-overcrowding funding signal.
Buy/sell ratio is 0.72, with sell orders in control. Short-term selling pressure is already reflected at the level of active trading.
For position levels, scenario-based reasoning:
If price retraces 960.85-974.57 (the focus range) and then shows acceptance under pressure—failing to push higher—then the bearish structure can be considered temporarily valid.
If price regains and holds above the invalidation reference at 979.44, it would mean the current pullback structure has been broken, and the bearish outlook should be abandoned.
If downside breaks 805.0 on increasing volume, then reassess whether support near 759.74 remains effective.
The contrarian risk that must be disclosed is that longs account for only 36% of accounts, while shorts account for a much higher share—suggesting the short side in the derivatives market is also overcrowded. If a squeeze-style rebound occurs, the risk of a short squeeze cannot be ruled out. This offsets the bearish evidence from both sell-side dominance and the RSI overbought signal, so it should not be ignored.
The reference risk-reward ratio of 8.4 is only a structural space calculation and does not represent win rate. The market may confirm or invalidate the current judgment at any time.
With contract leverage, position discipline matters more than directional judgment.
Live disclosure: This account currently holds $FOGO long positions. Structurally, I continue to look for upside, and my view is consistent with my positioning.
For reference only and does not constitute investment advice. Contracts involve leverage; investing is risky.
This article was generated with assistance from an OpenAI model.
$ZEC
#Contract Analysis
$ZEC Bearish Outlook | Focus Range 960.85 - 974.57 | Invalidation Reference 979.44 | Observation Levels 805.0 / 759.74
The current bearish structure of $ZEC is unfolding.
The core argument is that sell-side orders are taking the lead (buy/sell ratio 0.72), RSI has already climbed to the overbought zone at 79.6, and this coincides with a 24-hour gain of 18.43% alongside a sharp 33.6% surge in open interest/position size. In the short term, this shows clear “high-level overcrowding.”
The key is whether the pullback can be held down within the focus range. If it cannot, the structure will not hold.
Recent high: 979.44, recent low: 805.0. The current price at 960.85 is already approaching the area near the previous high.
Bollinger Bands show: upper band 995.28, middle band 877.51, lower band 759.74. Price is trading above the middle band, at a relatively elevated position.
The Supertrend indicator still signals upward movement, and MACD maintains bullish momentum. These two trend-type indicators have not yet turned, but there is now a divergence-style risk compared with the RSI 79.6 overbought signal. Momentum has entered the danger zone earlier than the broader trend indicators.
Over the past 24 hours, trading volume reached $2.083 billion. Open interest is $565 million, and it surged 33.6% within 24 hours. This indicates that while price is rising, a large amount of new capital is flowing into the derivatives market, with turnover accelerating noticeably.
The funding rate is only +0.0082%, which is neutral to relatively low. There is not yet an extreme long-overcrowding funding signal.
Buy/sell ratio is 0.72, with sell orders in control. Short-term selling pressure is already reflected at the level of active trading.
For position levels, scenario-based reasoning:
If price retraces 960.85-974.57 (the focus range) and then shows acceptance under pressure—failing to push higher—then the bearish structure can be considered temporarily valid.
If price regains and holds above the invalidation reference at 979.44, it would mean the current pullback structure has been broken, and the bearish outlook should be abandoned.
If downside breaks 805.0 on increasing volume, then reassess whether support near 759.74 remains effective.
The contrarian risk that must be disclosed is that longs account for only 36% of accounts, while shorts account for a much higher share—suggesting the short side in the derivatives market is also overcrowded. If a squeeze-style rebound occurs, the risk of a short squeeze cannot be ruled out. This offsets the bearish evidence from both sell-side dominance and the RSI overbought signal, so it should not be ignored.
The reference risk-reward ratio of 8.4 is only a structural space calculation and does not represent win rate. The market may confirm or invalidate the current judgment at any time.
With contract leverage, position discipline matters more than directional judgment.
Live disclosure: This account currently holds $FOGO long positions. Structurally, I continue to look for upside, and my view is consistent with my positioning.
For reference only and does not constitute investment advice. Contracts involve leverage; investing is risky.
This article was generated with assistance from an OpenAI model.
$ZEC
#Contract Analysis