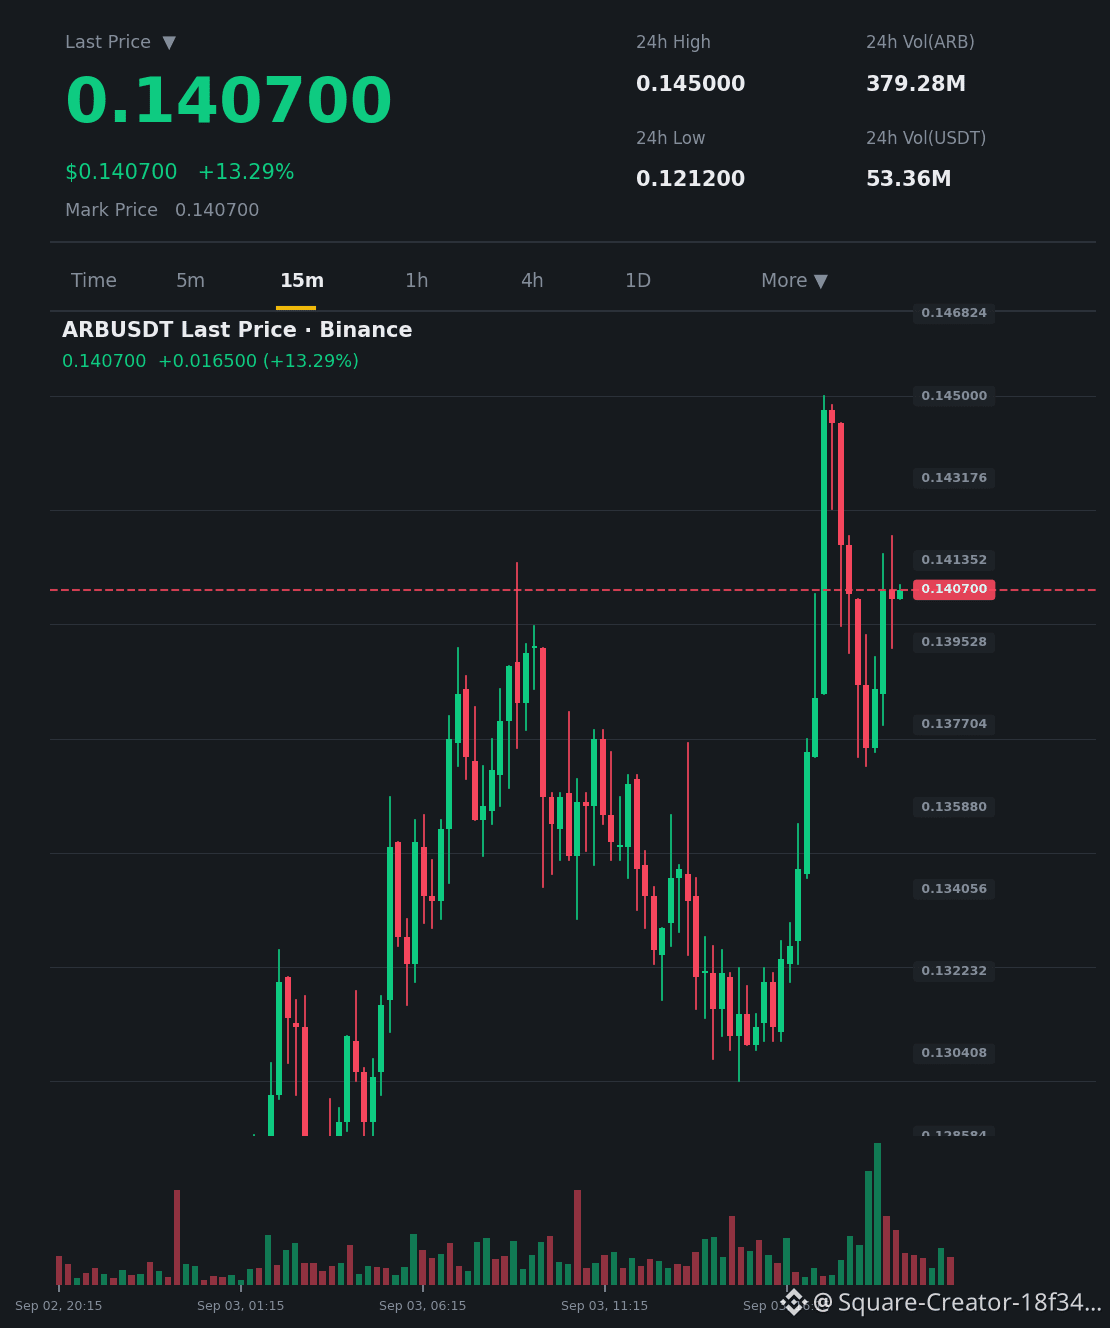
$ARB jumps 15.6% in 24 hours... but does the 0.03x trading volume support this breakout? 📈
The price rose to $0.1407, driven by a sharp buying wave on the 15-minute chart. However, the volume ratio at 0.03 indicates extremely weak liquidity compared to normal levels, raising doubts about the movement’s sustainability. The RSI indicator is approaching overbought zones, increasing the likelihood of a near-term technical pullback.
Positive scenario: If the price holds above $0.1400 and volume returns as it rises, the rally could extend toward $0.1500.
Negative scenario: If volume remains thin, momentum will fade, with a quick correction toward $0.1300 – $0.1250 to fill the liquidity gap.
The key factor now is to monitor trading volume in the coming hours to confirm the breakout’s validity.
Do you think this rally marks the start of a new trend, or just a weak-volume speculation? 🤔
$ARB
This content is not investment advice—do your own research (DYOR)
The price rose to $0.1407, driven by a sharp buying wave on the 15-minute chart. However, the volume ratio at 0.03 indicates extremely weak liquidity compared to normal levels, raising doubts about the movement’s sustainability. The RSI indicator is approaching overbought zones, increasing the likelihood of a near-term technical pullback.
Positive scenario: If the price holds above $0.1400 and volume returns as it rises, the rally could extend toward $0.1500.
Negative scenario: If volume remains thin, momentum will fade, with a quick correction toward $0.1300 – $0.1250 to fill the liquidity gap.
The key factor now is to monitor trading volume in the coming hours to confirm the breakout’s validity.
Do you think this rally marks the start of a new trend, or just a weak-volume speculation? 🤔
$ARB
This content is not investment advice—do your own research (DYOR)