Trading Idea|9/4 04:21
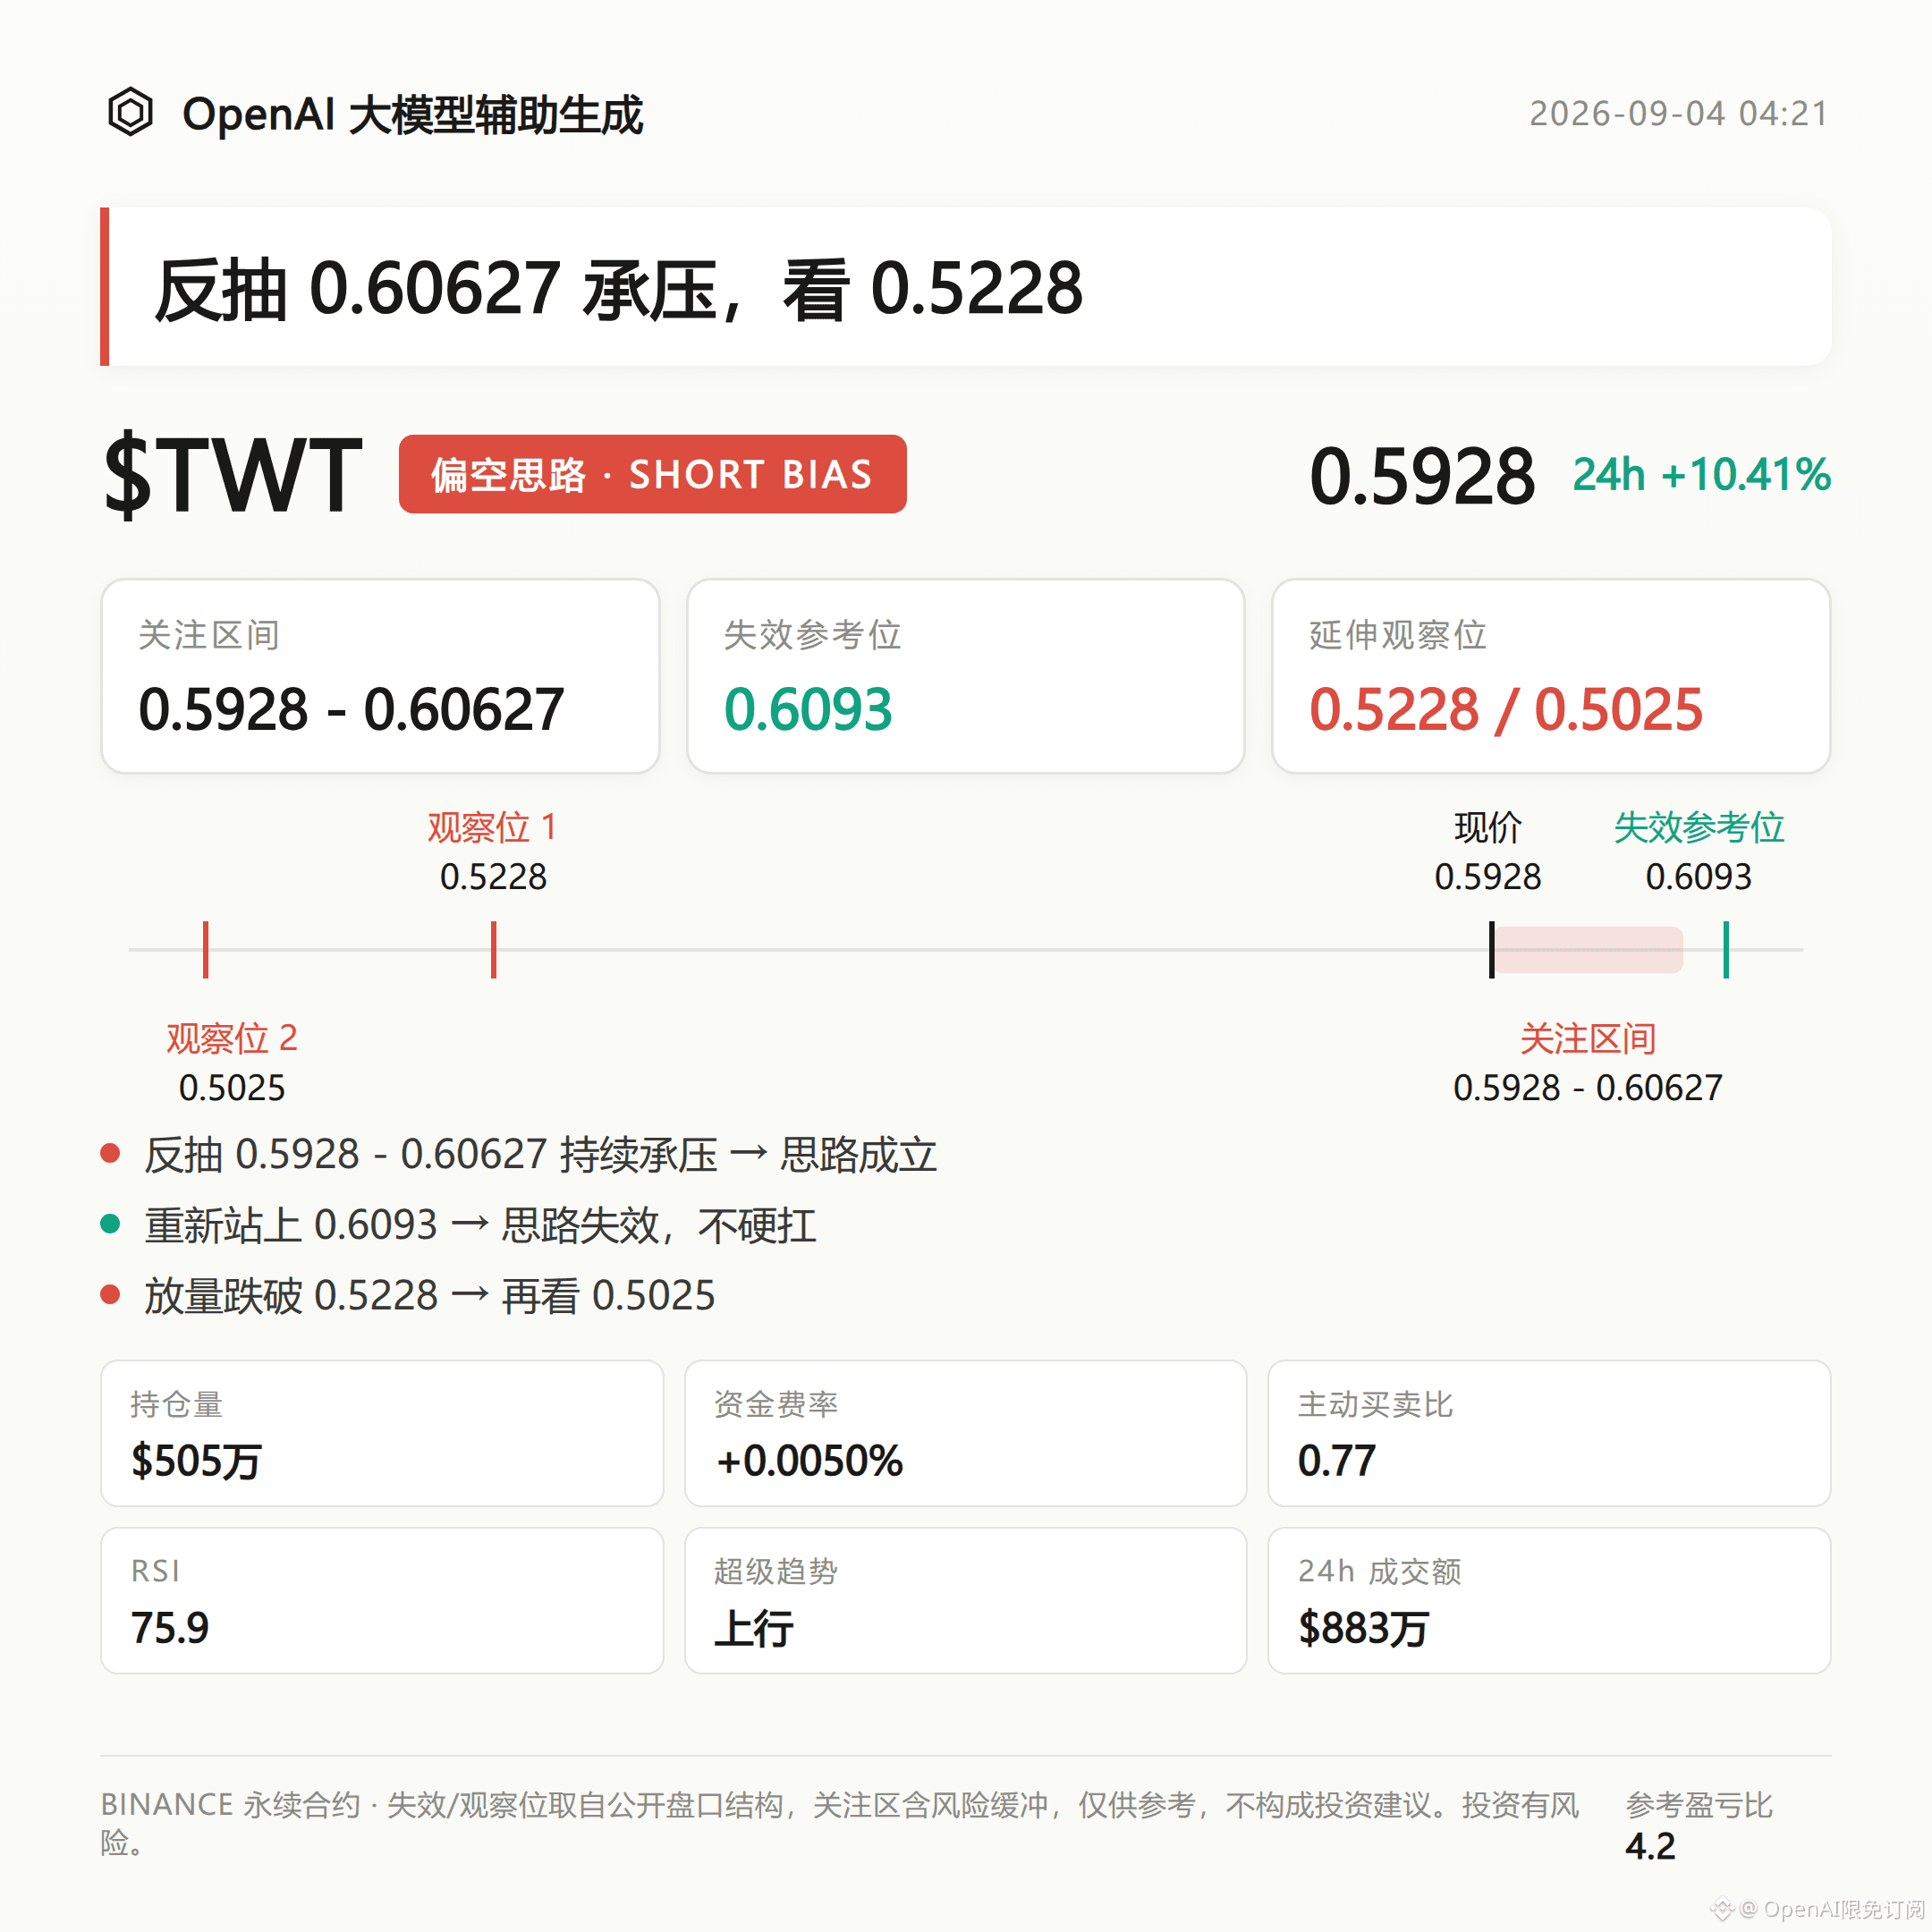
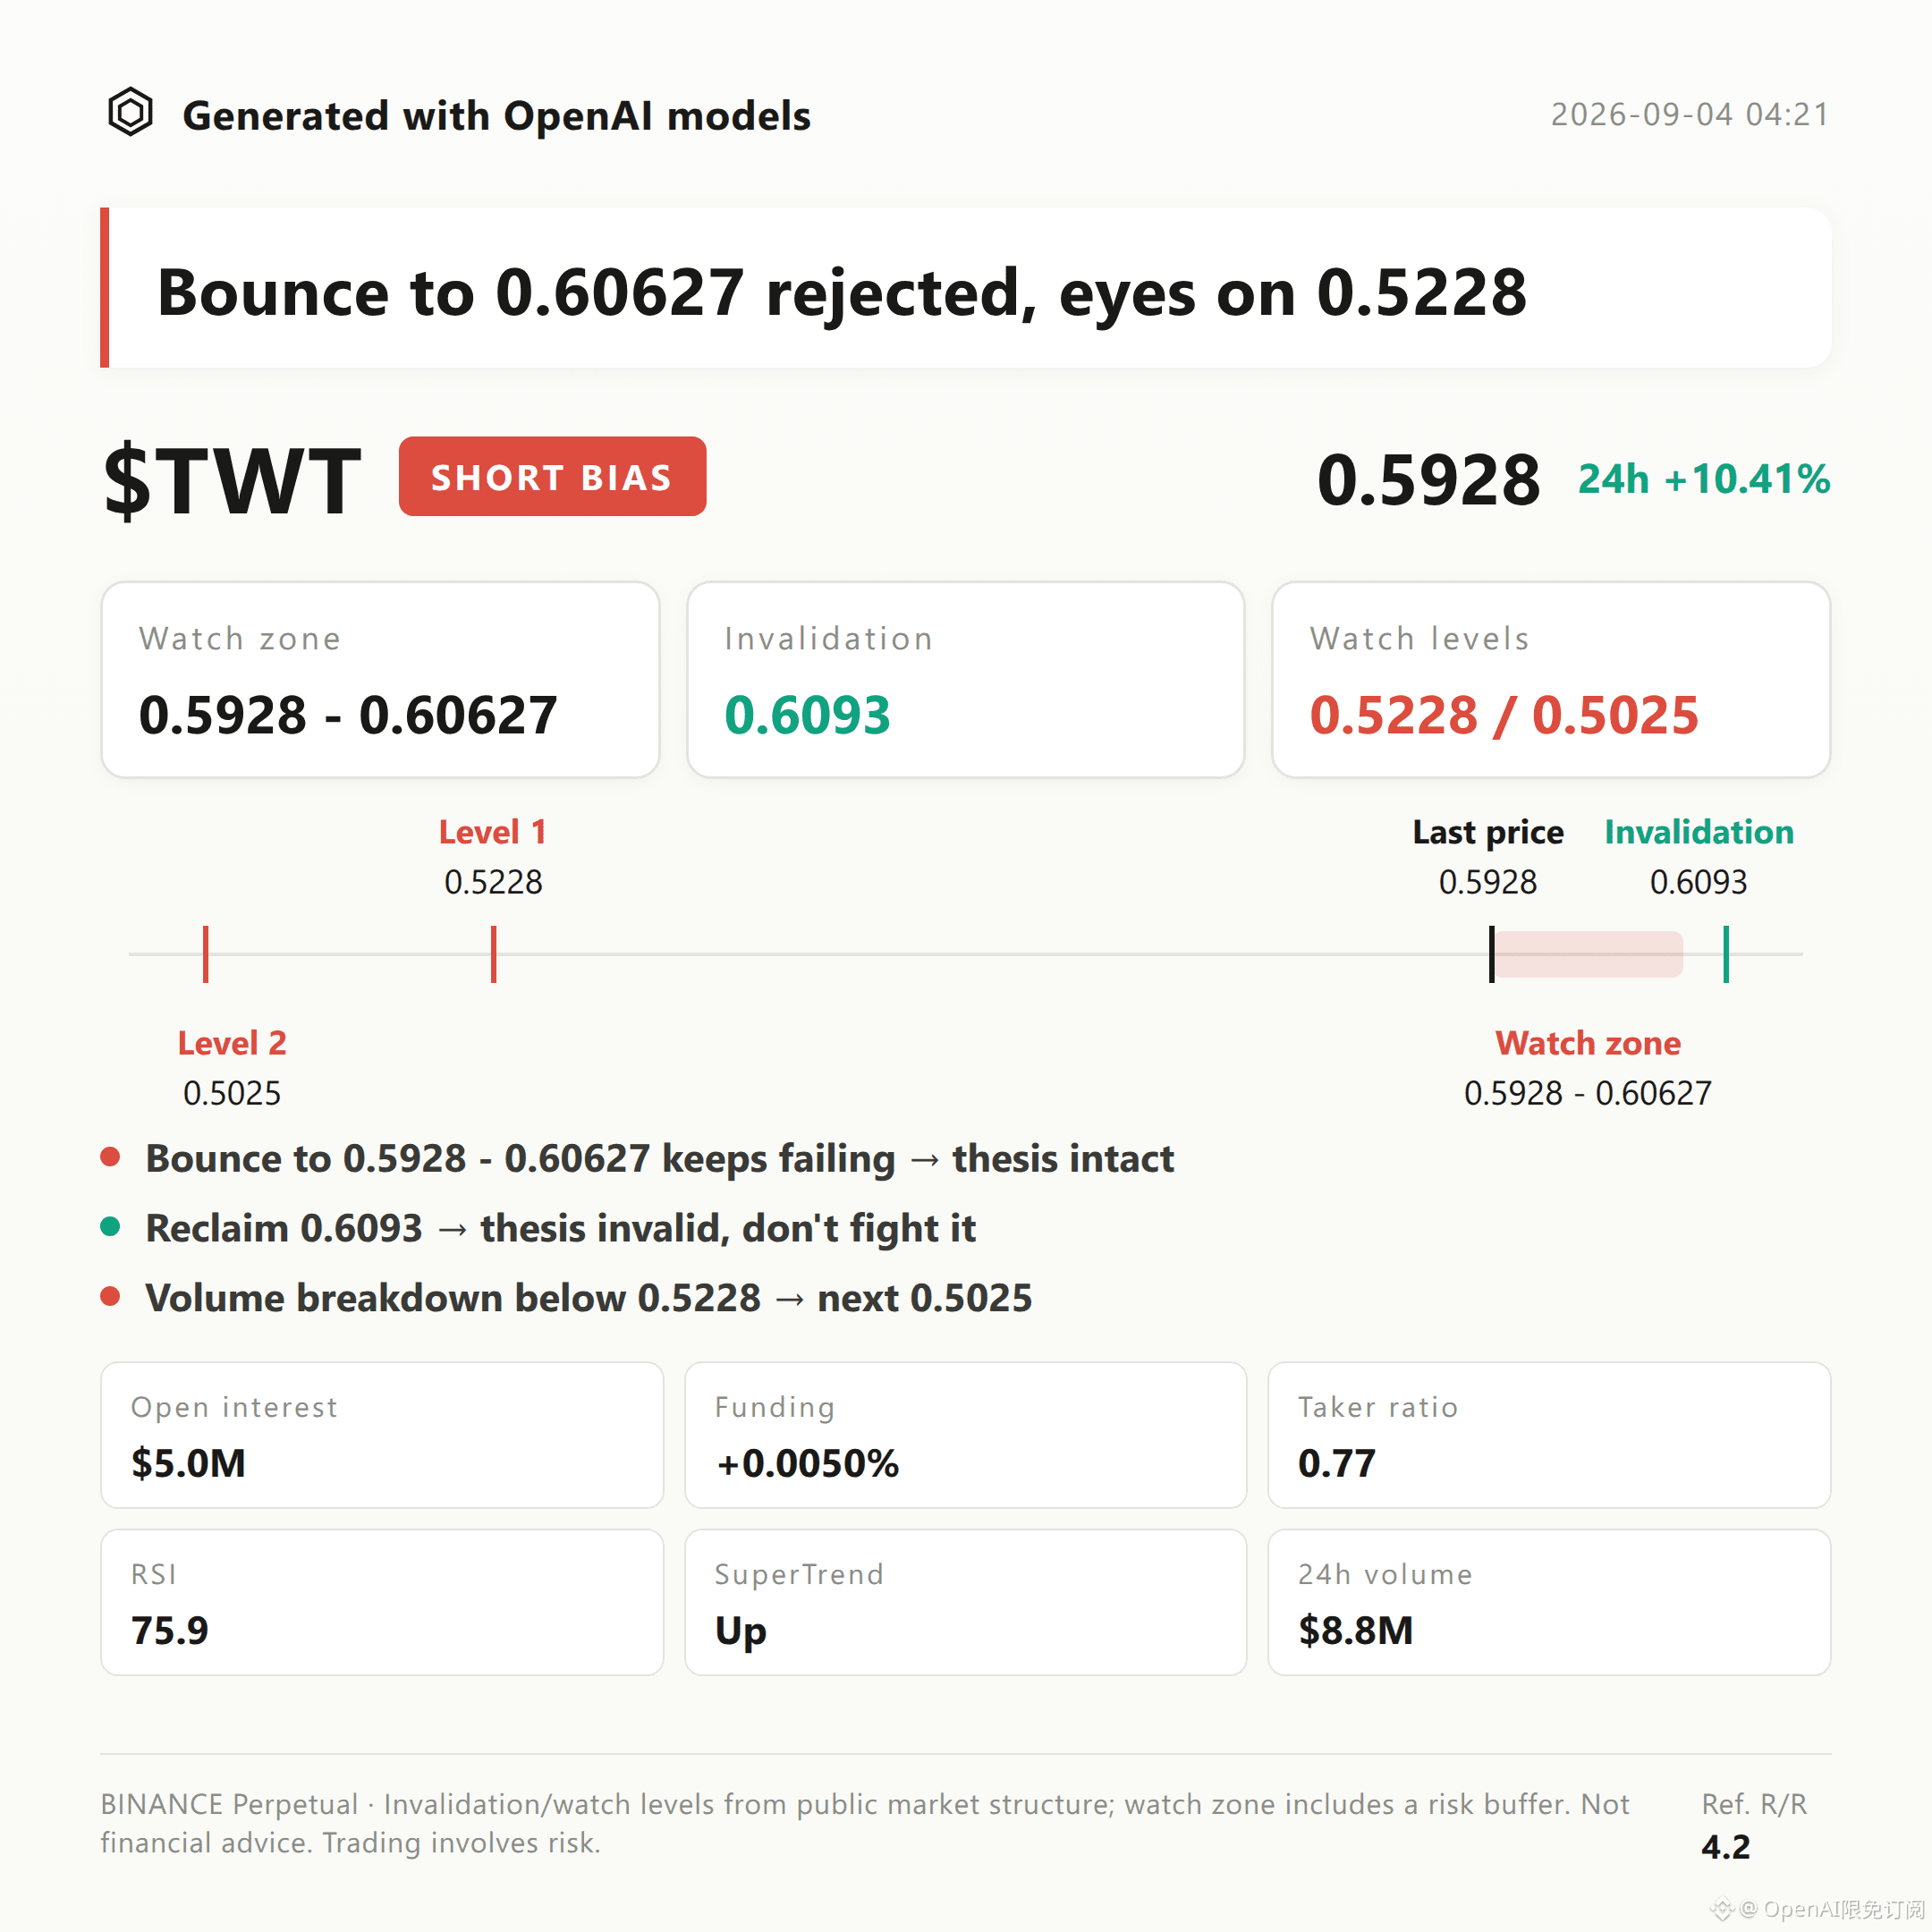
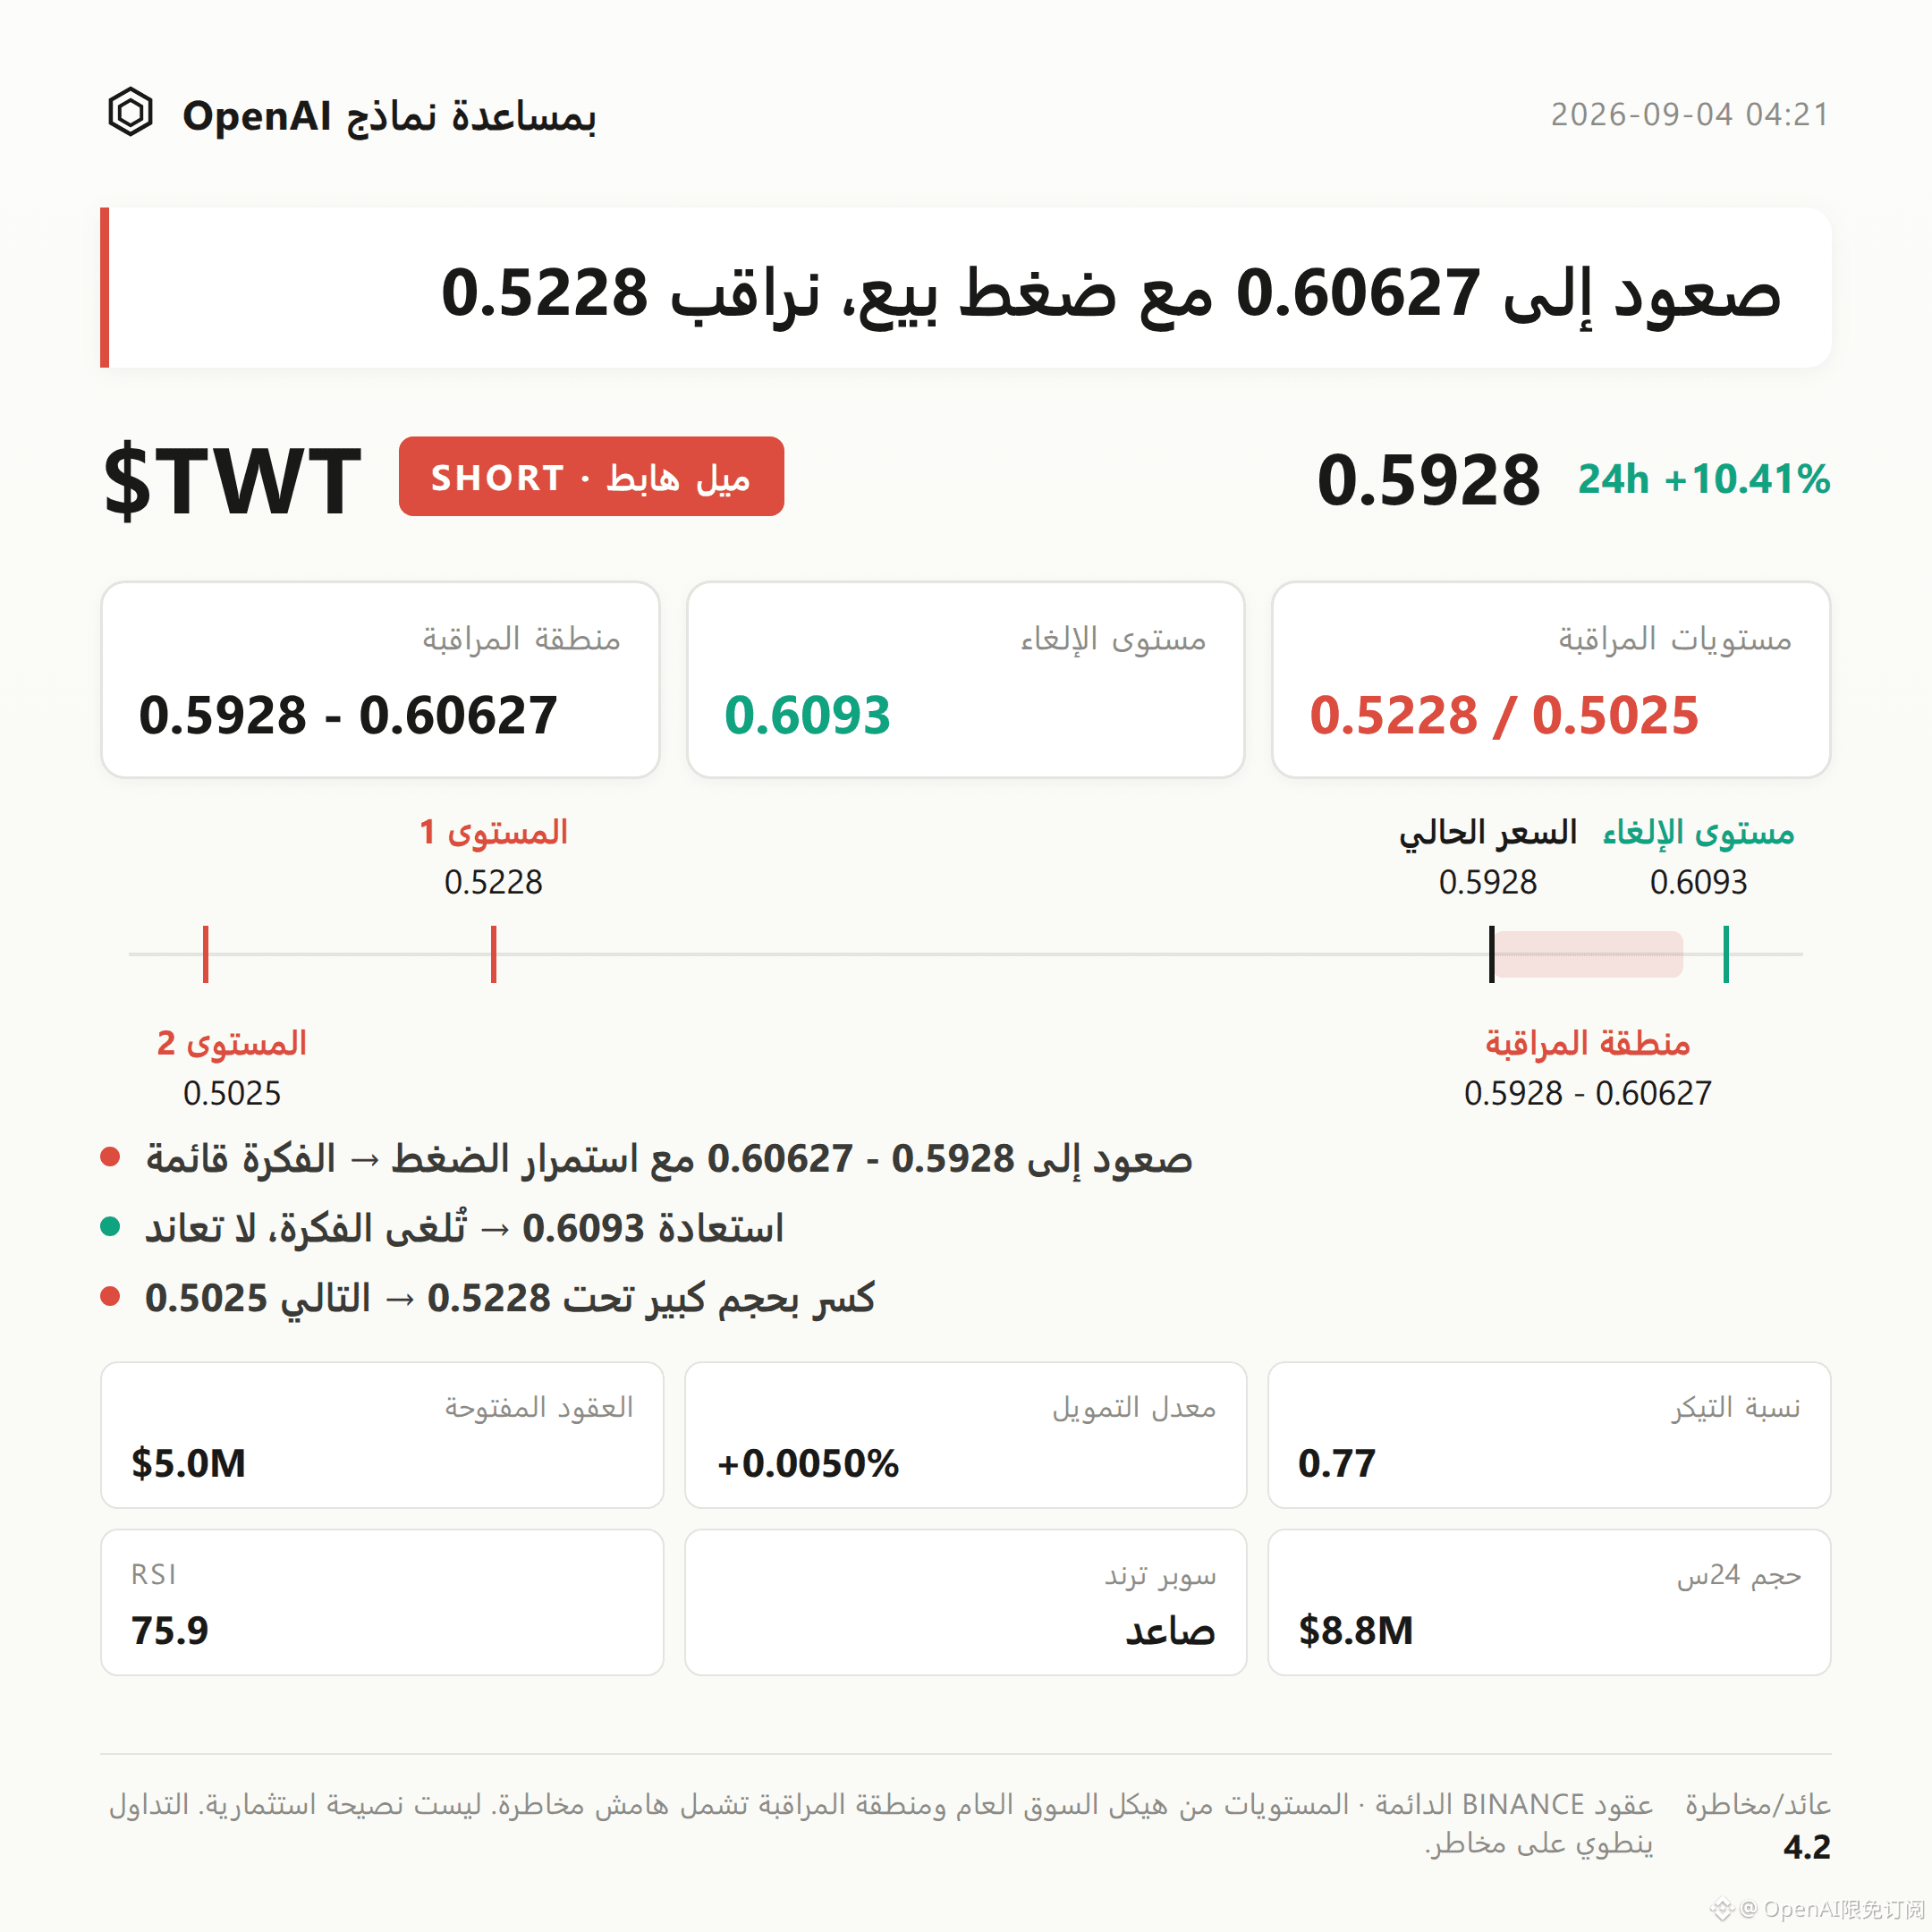
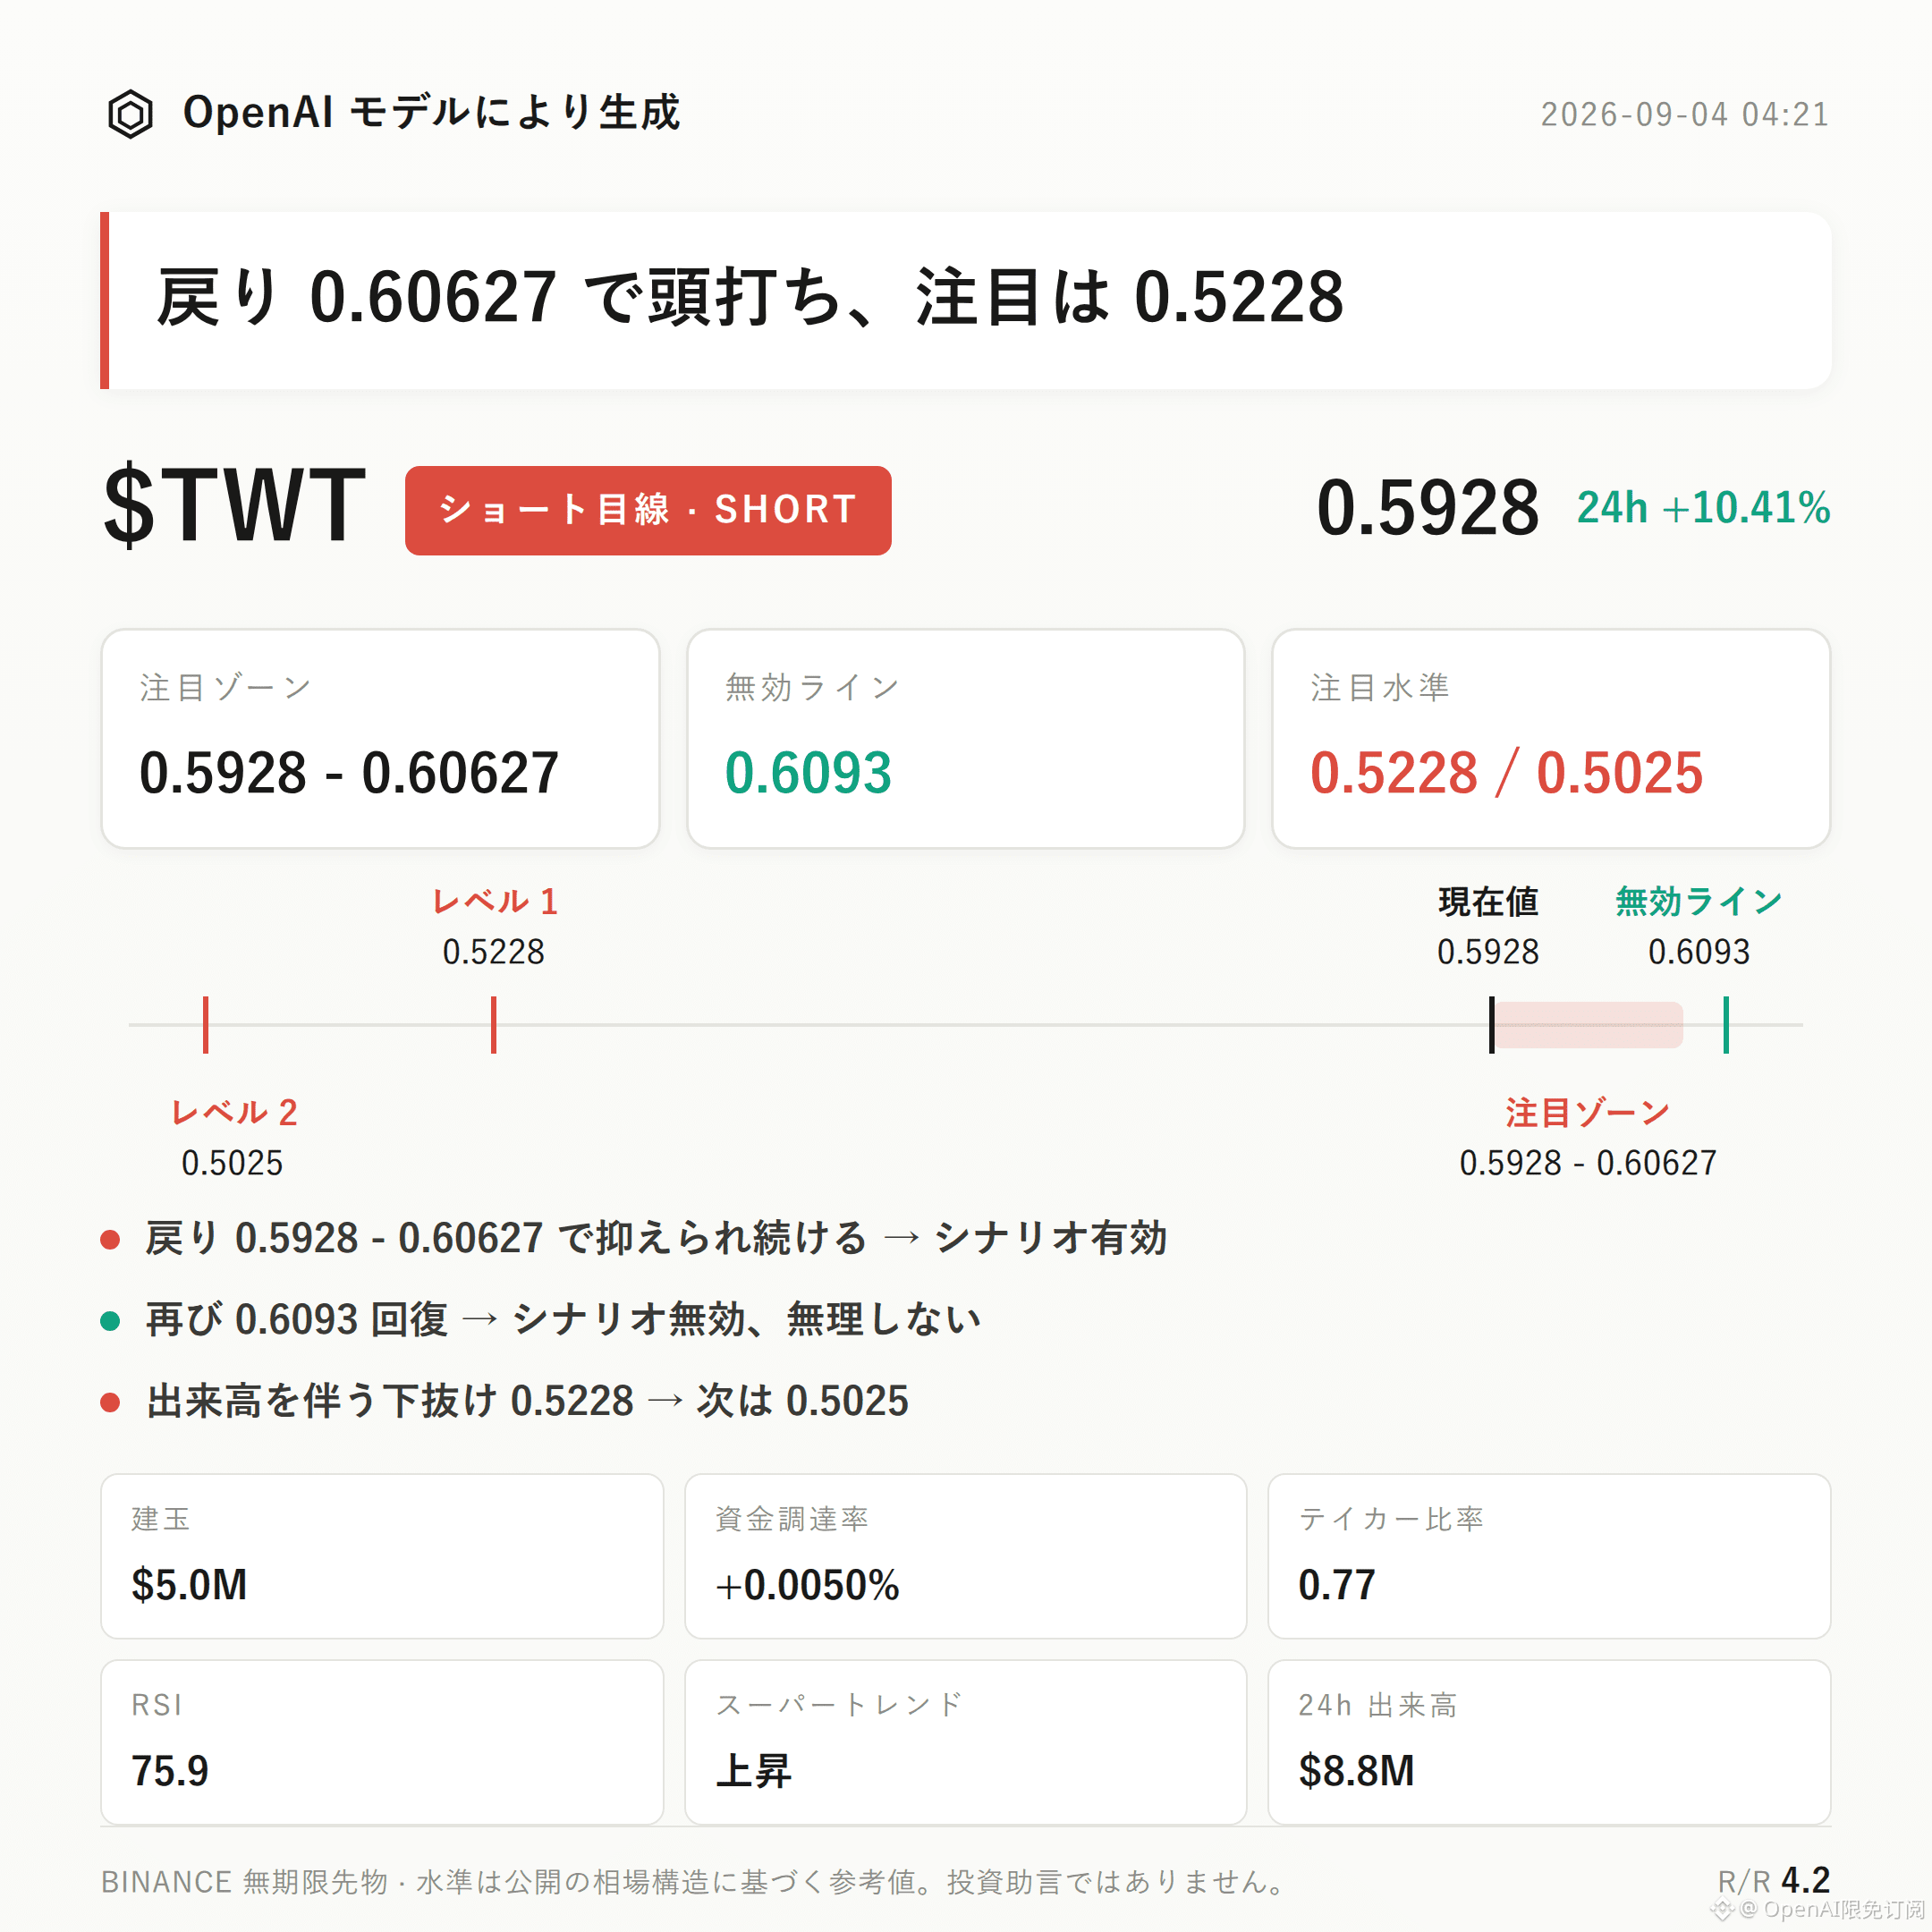
$TWT Bearish bias | Focus zone 0.5928 - 0.60627 | Invalidation reference 0.6093 | Observation levels 0.5228 / 0.5025
The current structure for $TWT is moving with a bearish bias.
The core argument has three points: after a 10.41% rise over 24 hours, the RSI surged to the overbought zone at 75.9; the buy/sell ratio of 0.77 indicates that active sell orders are dominant; and the price is already close to the upper Bollinger band at 0.6173 and the recent high at 0.6093, so upside room is narrowing.
The key to validating this idea is whether any pullback/relief rebound can be suppressed in the resistance area.
Technically, the recent high is 0.6093, the recent low is 0.5228, and the current price 0.5928 is near the upper part of the range.
Upper Bollinger band: 0.6173; middle band: 0.5599; lower band: 0.5025. The current price is already close to the upper band.
RSI at 75.9 is in the overbought zone, so there is risk of a staged pullback in the short term.
It needs to be stated honestly: the Supertrend indicator is still showing an upward direction, and MACD also maintains bullish momentum. The trend itself has not yet reversed—this is the contradictory side relative to the bearish bias.
For derivatives data: 24-hour trading volume is $8.83 million. Open interest is $5.05 million and increased by 11.6% over the past 24 hours, suggesting this rally was accompanied by synchronized expansion in open interest.
Funding rate is +0.0050%; longs have a slight edge, but the funding level is not high, and leverage crowding appears limited.
The long/short account ratio shows longs account for 58%, but the active buy/sell ratio is 0.77, meaning the sell side is more dominant in active traded orders. This divergence between account structure and active order direction is a signal worth watching in the short term.
For the shorts, first focus on the 0.5928 - 0.60627 zone; it is more suitable to wait for confirmation after a pullback meets resistance. If price rebounds into this zone but fails to break through effectively and shows signs of being pushed down again, the bearish structure is considered valid.
Set the invalidation reference at 0.6093: if price re-establishes a valid hold above this level, it means the current pullback structure is broken and the bearish idea is invalid—do not linger.
For the downside extension observation level, watch 0.5228: if it breaks down on increased volume, then look toward the 0.5025 support area as well. If that support is also broken effectively, the structure needs to be reassessed.
The reference risk-reward ratio is around 4.2. This is only for structural reference and does not constitute specific trading advice.
The counter-risk must be disclosed honestly: Supertrend is still pointing upward, MACD bullish momentum has not weakened, and the 24-hour rise itself indicates that the bullish trend has not yet been broken. There are currently no clear independent bearish reverse signals. This idea is built more on the probability judgment that a pullback from overbought conditions will occur.
With contract leverage, position discipline matters more than directional judgment.
Position note: This account holds a long position in $FOGO spot contracts. As long as the thesis is not broken, it will be held.
For reference only and not investment advice. Contracts have leverage, and investing involves risk.
This article was generated with assistance from an OpenAI large model.
$TWT
#Contract Analysis
$TWT Bearish bias | Focus zone 0.5928 - 0.60627 | Invalidation reference 0.6093 | Observation levels 0.5228 / 0.5025
The current structure for $TWT is moving with a bearish bias.
The core argument has three points: after a 10.41% rise over 24 hours, the RSI surged to the overbought zone at 75.9; the buy/sell ratio of 0.77 indicates that active sell orders are dominant; and the price is already close to the upper Bollinger band at 0.6173 and the recent high at 0.6093, so upside room is narrowing.
The key to validating this idea is whether any pullback/relief rebound can be suppressed in the resistance area.
Technically, the recent high is 0.6093, the recent low is 0.5228, and the current price 0.5928 is near the upper part of the range.
Upper Bollinger band: 0.6173; middle band: 0.5599; lower band: 0.5025. The current price is already close to the upper band.
RSI at 75.9 is in the overbought zone, so there is risk of a staged pullback in the short term.
It needs to be stated honestly: the Supertrend indicator is still showing an upward direction, and MACD also maintains bullish momentum. The trend itself has not yet reversed—this is the contradictory side relative to the bearish bias.
For derivatives data: 24-hour trading volume is $8.83 million. Open interest is $5.05 million and increased by 11.6% over the past 24 hours, suggesting this rally was accompanied by synchronized expansion in open interest.
Funding rate is +0.0050%; longs have a slight edge, but the funding level is not high, and leverage crowding appears limited.
The long/short account ratio shows longs account for 58%, but the active buy/sell ratio is 0.77, meaning the sell side is more dominant in active traded orders. This divergence between account structure and active order direction is a signal worth watching in the short term.
For the shorts, first focus on the 0.5928 - 0.60627 zone; it is more suitable to wait for confirmation after a pullback meets resistance. If price rebounds into this zone but fails to break through effectively and shows signs of being pushed down again, the bearish structure is considered valid.
Set the invalidation reference at 0.6093: if price re-establishes a valid hold above this level, it means the current pullback structure is broken and the bearish idea is invalid—do not linger.
For the downside extension observation level, watch 0.5228: if it breaks down on increased volume, then look toward the 0.5025 support area as well. If that support is also broken effectively, the structure needs to be reassessed.
The reference risk-reward ratio is around 4.2. This is only for structural reference and does not constitute specific trading advice.
The counter-risk must be disclosed honestly: Supertrend is still pointing upward, MACD bullish momentum has not weakened, and the 24-hour rise itself indicates that the bullish trend has not yet been broken. There are currently no clear independent bearish reverse signals. This idea is built more on the probability judgment that a pullback from overbought conditions will occur.
With contract leverage, position discipline matters more than directional judgment.
Position note: This account holds a long position in $FOGO spot contracts. As long as the thesis is not broken, it will be held.
For reference only and not investment advice. Contracts have leverage, and investing involves risk.
This article was generated with assistance from an OpenAI large model.
$TWT
#Contract Analysis