$BTC Repeating Its Daily Pattern on the 15m Chart! 📈‼️
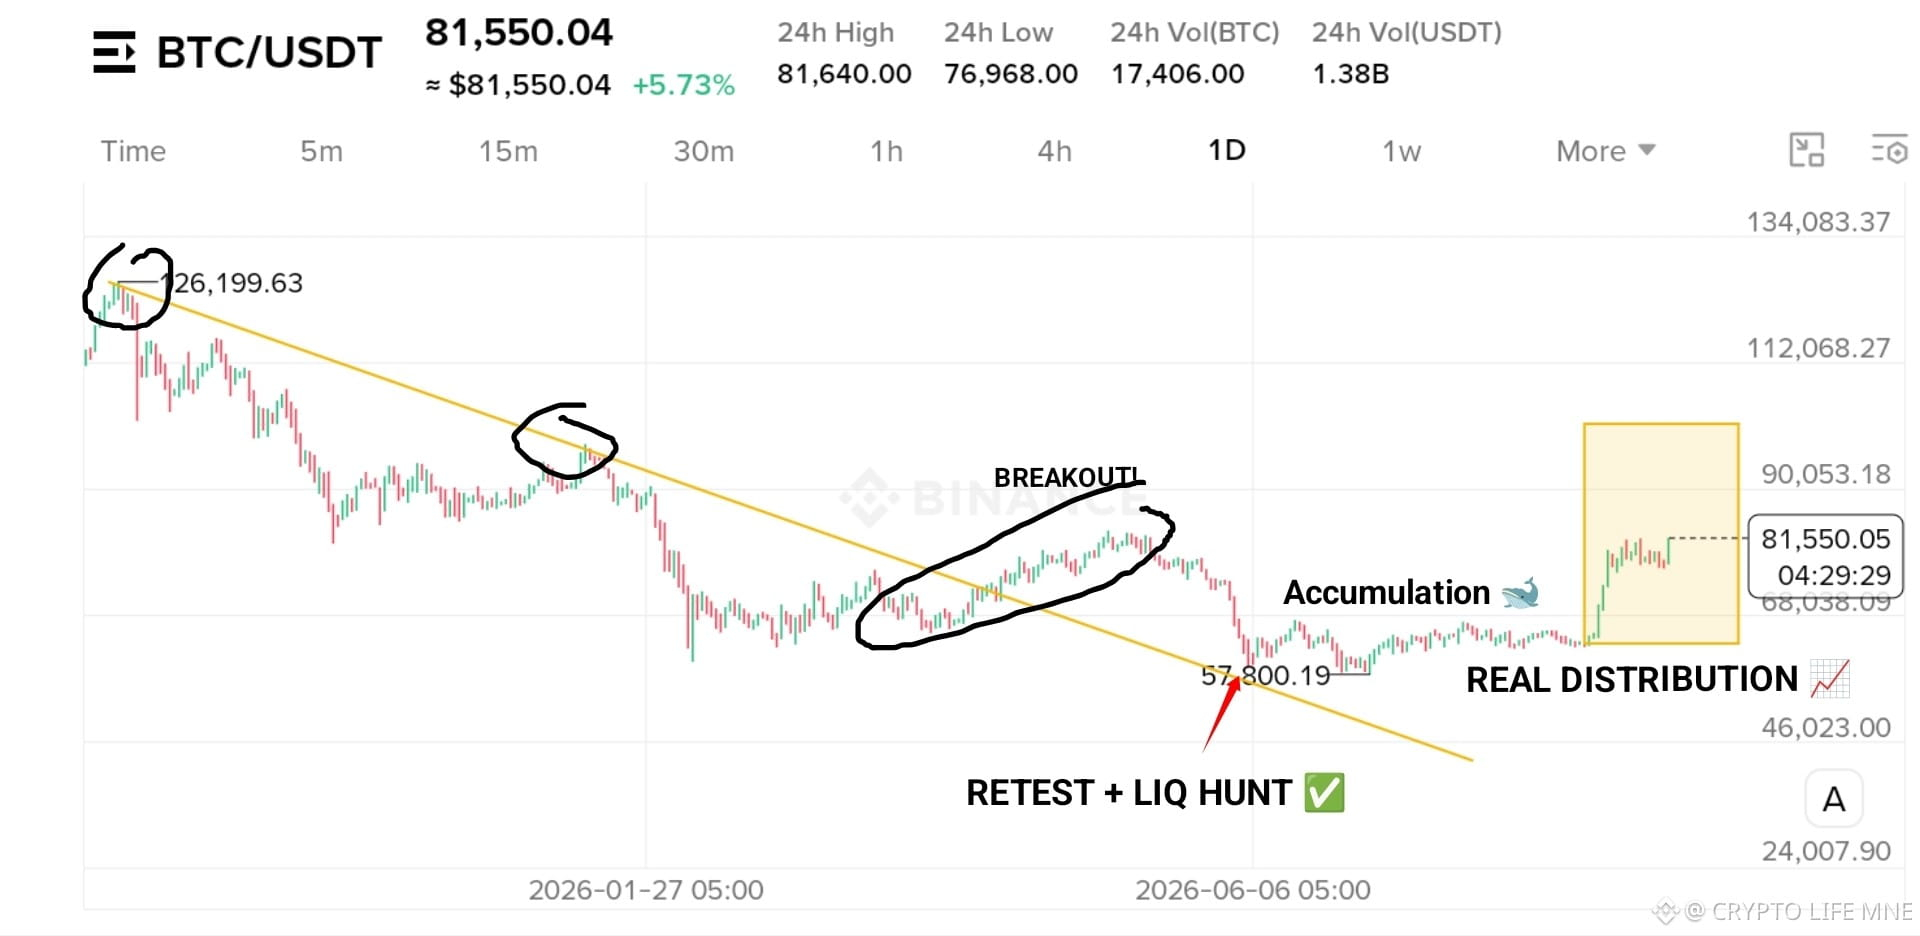
On the Daily (1D) chart, Bitcoin broke above a falling trendline, making many traders open long positions. Soon after, price pulled back to retest the trendline and swept key stop-losses (liquidity hunt).
After a long period of accumulation, $BTC finally started its expansion upward. 🚀
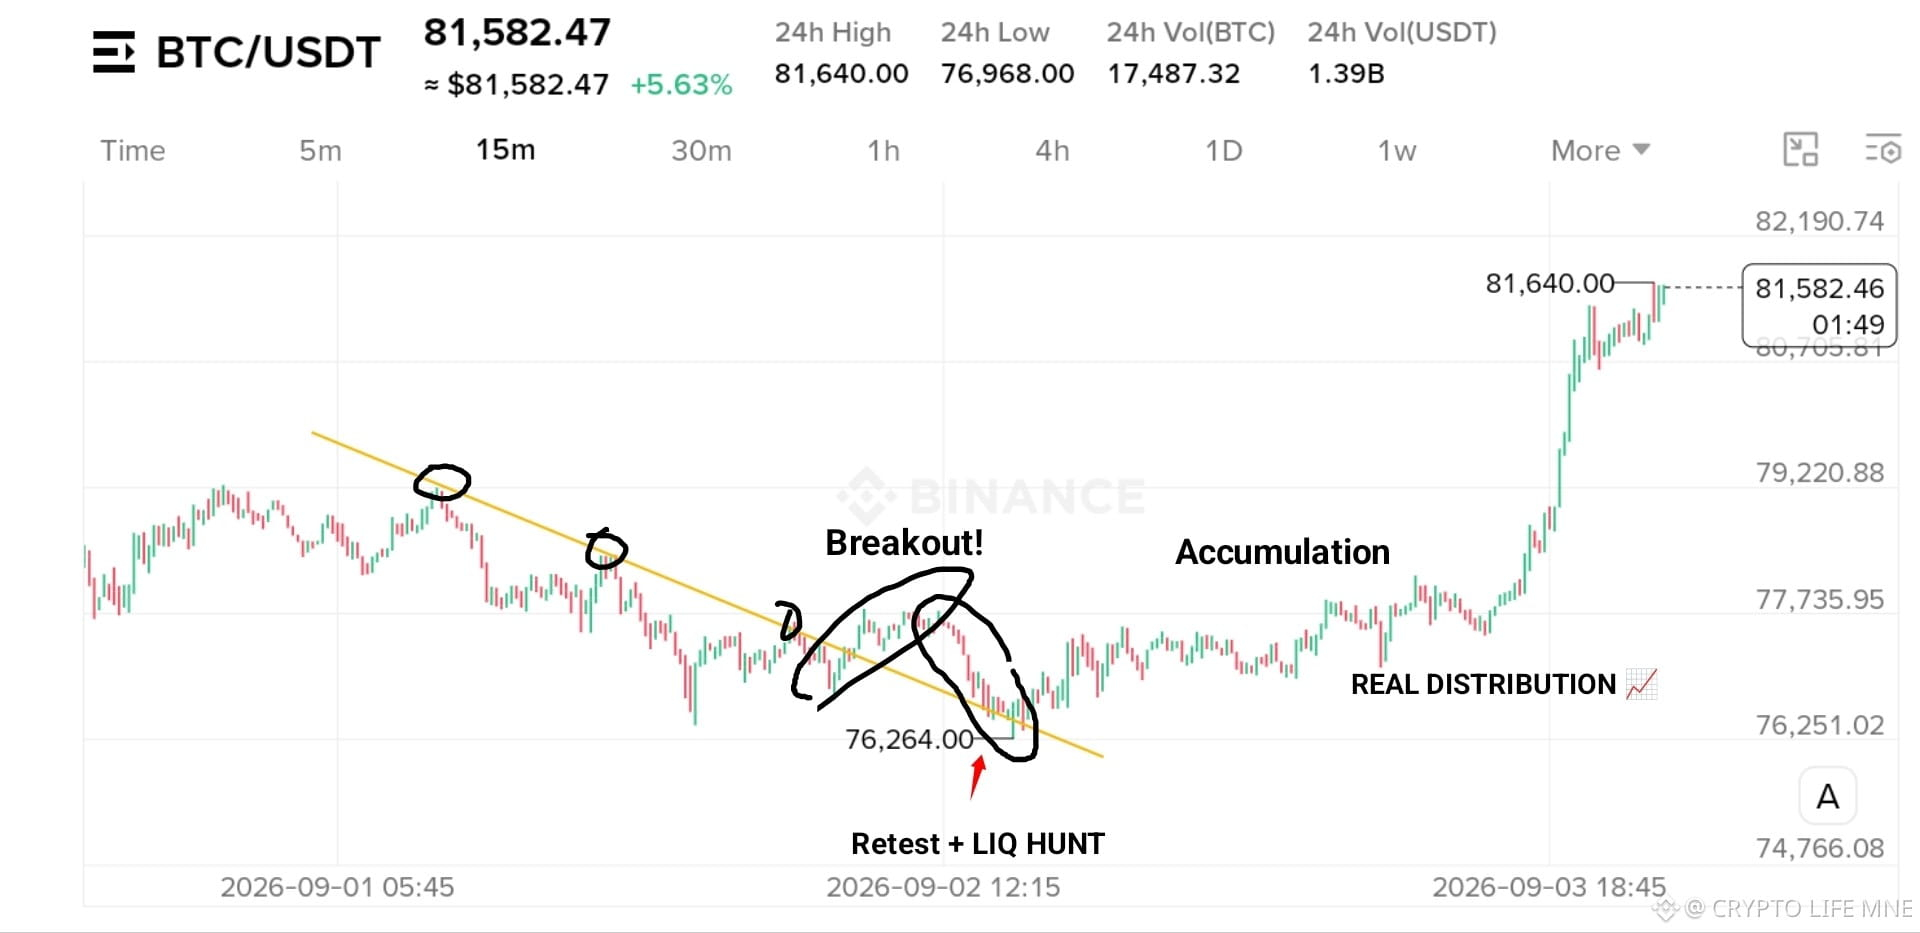
Today, the 15m chart is copying this exact pattern step-by-step:
Trendline Breakout 📈
Retest + Liquidity Hunt 🧹
Accumulation 🛒
Upward Move (Distribution) 📈
🎯 I am watching this zone : $82,000 – $85,000
$BTC
#BTC
On the Daily (1D) chart, Bitcoin broke above a falling trendline, making many traders open long positions. Soon after, price pulled back to retest the trendline and swept key stop-losses (liquidity hunt).
After a long period of accumulation, $BTC finally started its expansion upward. 🚀
Today, the 15m chart is copying this exact pattern step-by-step:
Trendline Breakout 📈
Retest + Liquidity Hunt 🧹
Accumulation 🛒
Upward Move (Distribution) 📈
🎯 I am watching this zone : $82,000 – $85,000
$BTC
#BTC