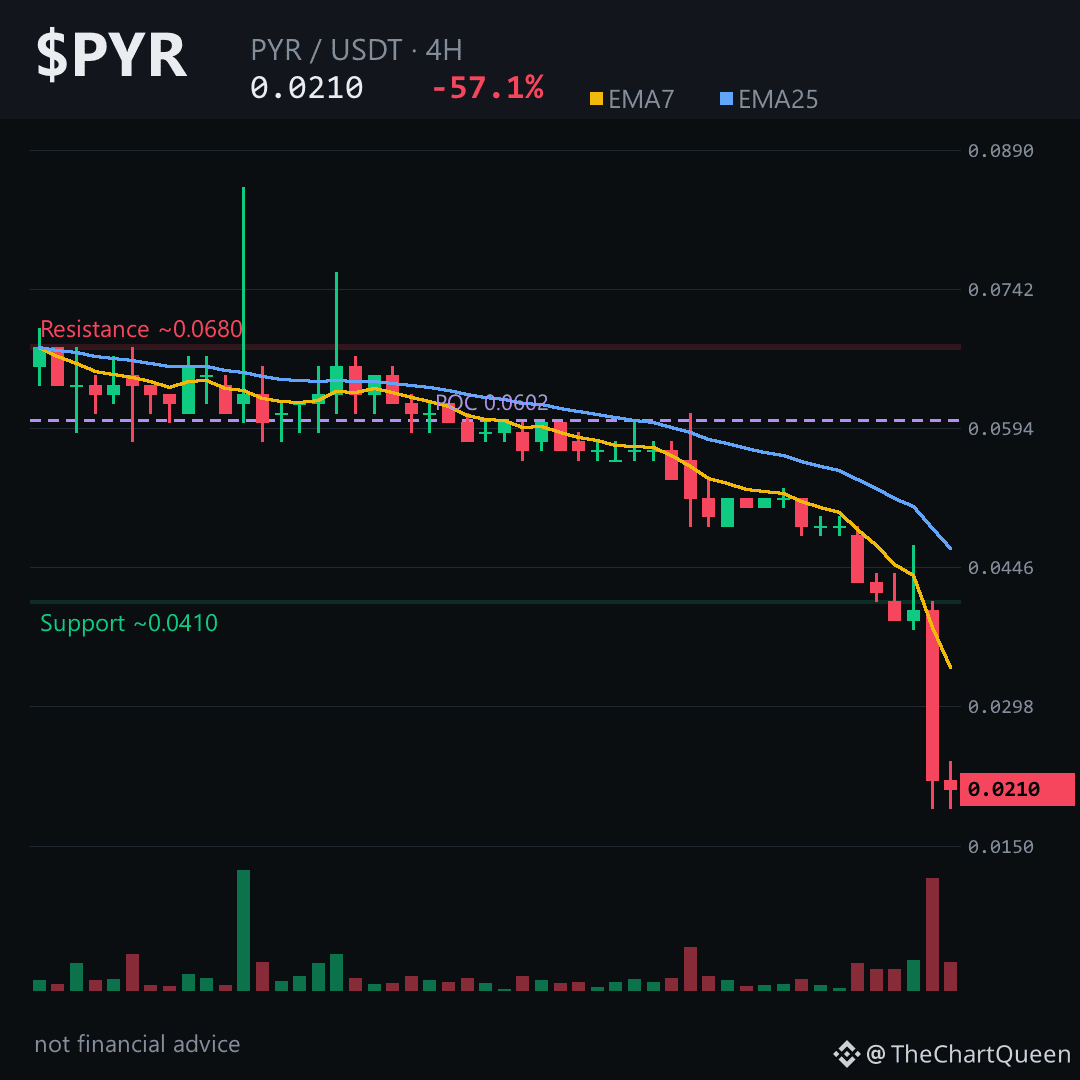
57% plunge in 24 h and the candle pack still hovers just above the 4‑hour pivot at ~0.0211 – a floor many chart watchers ignore. The hidden pattern? A bearish FVG cradles the price while the EMA ribbon is sharply reversed.
Price looks bearish, yet neutral funding and flat open interest whisper that the slide isn’t being driven by aggressive longs. RSI stuck in the single‑digits flags extreme weakness, and the volume‑profile POC sits far above current levels, leaving little buying pressure.
On the 4 h chart the current area sits around ~0.0211; a break above the ~0.0222 zone would invalidate the bearish read, while the next target lies near the ~0.0192 objective zone. Tap $PYR to pull up the chart and see these zones yourself.
My read: $PYR is likely to test the ~0.0192 area unless it rebounds above the ~0.0222 barrier.
Follow me for the next update when that barrier holds or flips – the next swing could reshape the picture. Which level are you watching on $PYR? 👇
⚠️ Not financial advice. DYOR.
#PYR #PyrToken #Crypto #BinanceSquare
Price looks bearish, yet neutral funding and flat open interest whisper that the slide isn’t being driven by aggressive longs. RSI stuck in the single‑digits flags extreme weakness, and the volume‑profile POC sits far above current levels, leaving little buying pressure.
On the 4 h chart the current area sits around ~0.0211; a break above the ~0.0222 zone would invalidate the bearish read, while the next target lies near the ~0.0192 objective zone. Tap $PYR to pull up the chart and see these zones yourself.
My read: $PYR is likely to test the ~0.0192 area unless it rebounds above the ~0.0222 barrier.
Follow me for the next update when that barrier holds or flips – the next swing could reshape the picture. Which level are you watching on $PYR? 👇
⚠️ Not financial advice. DYOR.
#PYR #PyrToken #Crypto #BinanceSquare