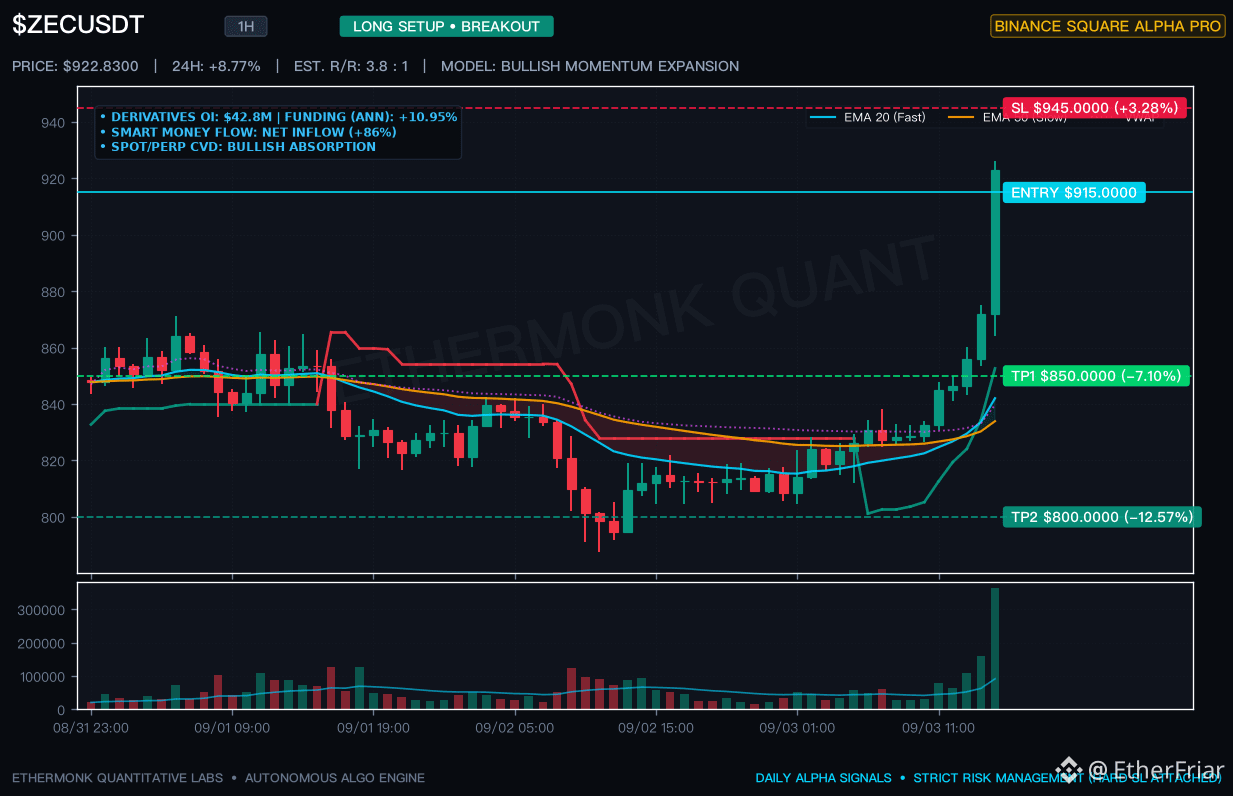
🚨【Ethereum Quant Analyst Report】$ZEC Breaks Through $918 and Soars +12%! The long/short ratio collapses to 0.30—The truth behind the century-level violent short squeeze and the top-ticking radar
Tonight, the crypto market is set for a brutal night. As Bitcoin strongly breaks $80,500 to hit a new high, the long-standing privacy leader $ZEC suddenly ignites a century-level bull run. During the intraday spike, it surged to $918.00, with 24-hour trading volume exceeding $1.16 billion, and a spike of over $200 million in a single hour!
Behind this explosive rally is not just a simple fundamental rebound, but a textbook-style “merciless liquidation of shorts by the bulls”—a brutal cleanup. Below is a deep dive into the underlying data and key battle positions:
---
📌 🔍 1. Order Book & Derivatives Severely Imbalanced: Shorts Become the “Free Fuel” for Big Whales
1. 🩸 The entire market crowds into shorting—long/short ratio collapses:
• ZECUSDC contract long/short ratio drops to an astonishing 0.3050 (shorts account for as much as 76.6%)!
• ZECUSDT whales’ short exposure ratio is also as high as 64.3%!
With over 70% of the market’s speculative capital betting on the top and shorting.
2. 💸 Funding rates deeply inverted:
• Annualized funding rate reaches -10.80%!
Shorts pay large interest to longs every 8 hours, making holding costs extremely high.
3. ⛓️ On-chain spot liquidity is extremely dry:
• Large circulating Zcash tokens are locked in the Orchard / Sapling privacy pools and cold addresses. Spot inventories on the secondary market are at a 2-year low.
Market makers only need to deploy a small amount of spot capital to push prices up, which can trigger a chain reaction in the derivatives market—short liquidation at market price (Buy Stop)—forming a self-propelling “bulls’ perpetual motion machine”!
---
📌 📊 2. Macroeconomic Catalyst Convergence: The Breakout Above $80k Gives Cover for the Move
1. 👑 Bitcoin breaks $80,500: Fed board member Waller’s dovish rate-cut signal + a weakening dollar. The correlation between BTC and gold hits a 6-year high, with hedging and anti-depreciation funds flowing in aggressively.
2. 🌊 Liquidity overflows across the board: Tech giants’ billion-dollar M&A (Nvidia acquiring Hugging Face) pushes the market into an extreme Risk-On preference, and capital quickly pours into flexible small-cap and derivatives-related targets.
---
📌 🎯 3. Key Long/Short Clash Levels & Top-Ticking Monitoring at High Levels
Currently, the 1-hour RSI has surged to a historical extreme overbought zone of 92.0 (the Blow-off Top peak eruption phase):
• 🚨 Maximum short-squeeze magnet area: $925.00 ~ $950.00 (the final liquidation point for shorts—the biggest whales are most likely to concentrate their distribution here)
• ⚠️ Short-term top confirmation signals: In the 15-minute or 1-hour candlesticks, a “long upper wick (≥28%)” appears, or a large bearish candle breaks below $890
• 📉 First pullback support target: $840.00 ~ $850.00 (the 1H EMA20 dynamic moving average; pullback depth around -8%)
• 🛡️ Defense zone for the breakout platform: $800.00 ~ $805.00
---
📌 💡 4. Operation Guide for Ethereum Quant Traders
1. ❌ Absolutely no blindly going heavy on the left side to try to pick the top at $915+; the main force is still enjoying the liquidity generated by the short liquidations.
2. 🎯 For right-side traders: closely watch the 15-minute chart. If the rally toward $920+ loses steam and closes with a bearish long upper wick, only then—after confirmation—use the breakout above the highest point to place a strict stop-loss (SL) and enter to bet on a rich mean-reversion profit back toward $850!
Follow the Ethereum quant trader, use quantitative data to see through the main force’s hidden cards, and help you stay in control during big market moves!
$ZEC #ZEC #BTC #量化交易
Tonight, the crypto market is set for a brutal night. As Bitcoin strongly breaks $80,500 to hit a new high, the long-standing privacy leader $ZEC suddenly ignites a century-level bull run. During the intraday spike, it surged to $918.00, with 24-hour trading volume exceeding $1.16 billion, and a spike of over $200 million in a single hour!
Behind this explosive rally is not just a simple fundamental rebound, but a textbook-style “merciless liquidation of shorts by the bulls”—a brutal cleanup. Below is a deep dive into the underlying data and key battle positions:
---
📌 🔍 1. Order Book & Derivatives Severely Imbalanced: Shorts Become the “Free Fuel” for Big Whales
1. 🩸 The entire market crowds into shorting—long/short ratio collapses:
• ZECUSDC contract long/short ratio drops to an astonishing 0.3050 (shorts account for as much as 76.6%)!
• ZECUSDT whales’ short exposure ratio is also as high as 64.3%!
With over 70% of the market’s speculative capital betting on the top and shorting.
2. 💸 Funding rates deeply inverted:
• Annualized funding rate reaches -10.80%!
Shorts pay large interest to longs every 8 hours, making holding costs extremely high.
3. ⛓️ On-chain spot liquidity is extremely dry:
• Large circulating Zcash tokens are locked in the Orchard / Sapling privacy pools and cold addresses. Spot inventories on the secondary market are at a 2-year low.
Market makers only need to deploy a small amount of spot capital to push prices up, which can trigger a chain reaction in the derivatives market—short liquidation at market price (Buy Stop)—forming a self-propelling “bulls’ perpetual motion machine”!
---
📌 📊 2. Macroeconomic Catalyst Convergence: The Breakout Above $80k Gives Cover for the Move
1. 👑 Bitcoin breaks $80,500: Fed board member Waller’s dovish rate-cut signal + a weakening dollar. The correlation between BTC and gold hits a 6-year high, with hedging and anti-depreciation funds flowing in aggressively.
2. 🌊 Liquidity overflows across the board: Tech giants’ billion-dollar M&A (Nvidia acquiring Hugging Face) pushes the market into an extreme Risk-On preference, and capital quickly pours into flexible small-cap and derivatives-related targets.
---
📌 🎯 3. Key Long/Short Clash Levels & Top-Ticking Monitoring at High Levels
Currently, the 1-hour RSI has surged to a historical extreme overbought zone of 92.0 (the Blow-off Top peak eruption phase):
• 🚨 Maximum short-squeeze magnet area: $925.00 ~ $950.00 (the final liquidation point for shorts—the biggest whales are most likely to concentrate their distribution here)
• ⚠️ Short-term top confirmation signals: In the 15-minute or 1-hour candlesticks, a “long upper wick (≥28%)” appears, or a large bearish candle breaks below $890
• 📉 First pullback support target: $840.00 ~ $850.00 (the 1H EMA20 dynamic moving average; pullback depth around -8%)
• 🛡️ Defense zone for the breakout platform: $800.00 ~ $805.00
---
📌 💡 4. Operation Guide for Ethereum Quant Traders
1. ❌ Absolutely no blindly going heavy on the left side to try to pick the top at $915+; the main force is still enjoying the liquidity generated by the short liquidations.
2. 🎯 For right-side traders: closely watch the 15-minute chart. If the rally toward $920+ loses steam and closes with a bearish long upper wick, only then—after confirmation—use the breakout above the highest point to place a strict stop-loss (SL) and enter to bet on a rich mean-reversion profit back toward $850!
Follow the Ethereum quant trader, use quantitative data to see through the main force’s hidden cards, and help you stay in control during big market moves!
$ZEC #ZEC #BTC #量化交易