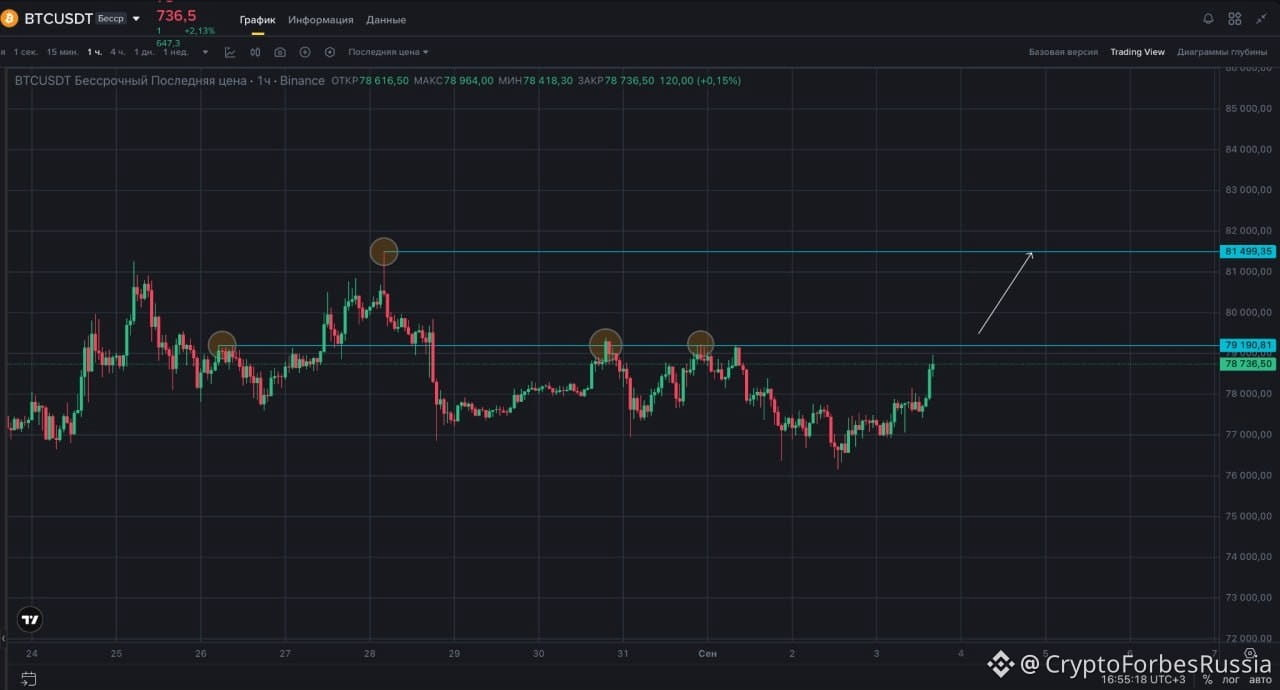
$BTC forms a structure around repeatedly confirmed resistance 79 100-79 200.
In the past few days, BTC has been trading in a wide range. At the same time, the area 79 190 has repeatedly stopped the buyer and sent the price back down.
The chart shows several pronounced reactions from this area.
The price has repeatedly been pushed up to the level, found a seller there, and returned back into the range. Thanks to repeated tests, the zone becomes especially attractive: above the local highs, an obvious liquidity pool is gradually forming.
If the market manages to take liquidity above the previous highs and does not immediately fall back under the level, there is a chance to continue toward the next significant zone.
✅take profit: 80 000–80 300
✅take profit: 80 800–81 000
✅take profit: 81 400–81 500
#BTC
In the past few days, BTC has been trading in a wide range. At the same time, the area 79 190 has repeatedly stopped the buyer and sent the price back down.
The chart shows several pronounced reactions from this area.
The price has repeatedly been pushed up to the level, found a seller there, and returned back into the range. Thanks to repeated tests, the zone becomes especially attractive: above the local highs, an obvious liquidity pool is gradually forming.
If the market manages to take liquidity above the previous highs and does not immediately fall back under the level, there is a chance to continue toward the next significant zone.
✅take profit: 80 000–80 300
✅take profit: 80 800–81 000
✅take profit: 81 400–81 500
#BTC