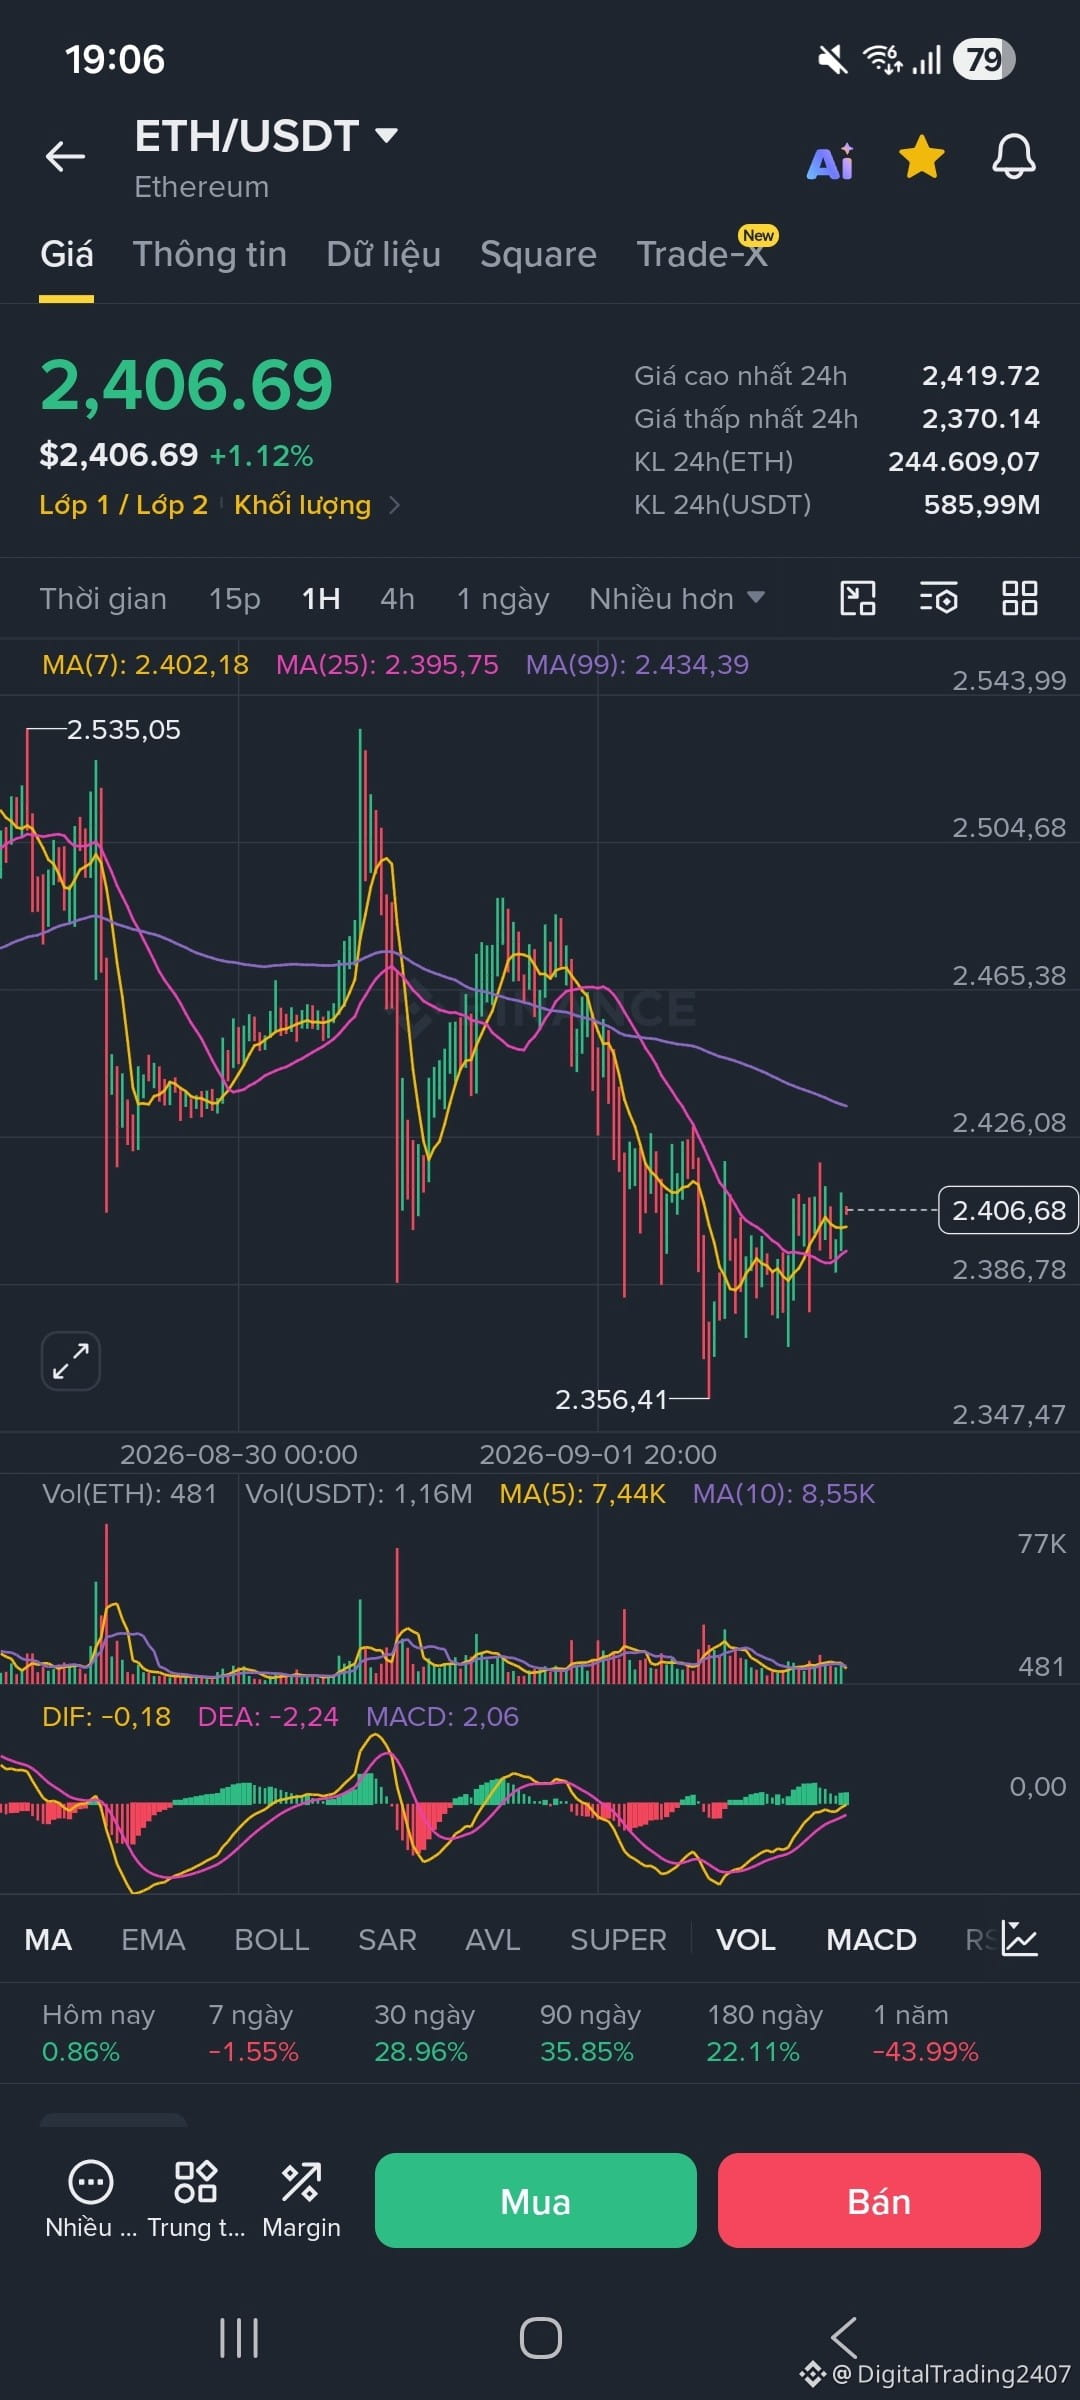
📊 ETH/USDT ANALYSIS - FROM EURO SESSION TO US SESSION
1. EURO SESSION OVERVIEW:
• Current price: 2,406.69 USDT (+1.12%)
• Status: ETH has set a temporary bottom at 2,356.41 USDT and shows a technical rebound wave during the European session.
• Short-term trend: Price has broken above the MA(7) and MA(25). The Bulls are temporarily controlling the short-term range. However, MA(99) dynamic resistance at the 2,434.39 USDT area is still sloping downward and weighing on the upside.
2. TECHNICAL INDICATORS (1H TIMEFRAME):
• Volume: Trading volume during the rebound is relatively low; no clear sign of large fund inflow (Volume Spike) proactively bottom-fishing.
• MACD: The histogram turns green and slopes upward. The DIF and DEA lines are preparing to form a Golden Cross below the 0 axis, supporting the rebound to test upside resistance zones.
3. STRATEGIC OUTLOOK FOR THE US SESSION:
• Resistance zone: 2,430 – 2,438 USDT (MA99 Zone)
• Support zone: 2,386 – 2,395 USDT (MA25 Zone) | Old bottom: 2,356 USDT
👉 TRADING SCENARIOS:
• Scenario 1 (LONG): If, at the beginning of the US session, the price Retests the 2,390 - 2,395 USDT area and forms a pullback candle (lower wick) -> Open a BUY/LONG position. Take-profit target: 2,435 USDT. Stoploss: Below 2,380 USDT.
• Scenario 2 (SHORT): If the price pushes up to the 2,434 - 2,438 USDT resistance area, but buy volume exhausts and a reversal candle appears (Pinbar, bearish engulfing / strong bearish rejection) -> Open a SELL/SHORT position in line with the larger trend. Stoploss: Above 2,450 USDT.
⚠️ NOTE: The US session often sweeps both ends with strong volatility. Manage risk strictly and place a complete Stoploss before major macro news is released.
$ETH
1. EURO SESSION OVERVIEW:
• Current price: 2,406.69 USDT (+1.12%)
• Status: ETH has set a temporary bottom at 2,356.41 USDT and shows a technical rebound wave during the European session.
• Short-term trend: Price has broken above the MA(7) and MA(25). The Bulls are temporarily controlling the short-term range. However, MA(99) dynamic resistance at the 2,434.39 USDT area is still sloping downward and weighing on the upside.
2. TECHNICAL INDICATORS (1H TIMEFRAME):
• Volume: Trading volume during the rebound is relatively low; no clear sign of large fund inflow (Volume Spike) proactively bottom-fishing.
• MACD: The histogram turns green and slopes upward. The DIF and DEA lines are preparing to form a Golden Cross below the 0 axis, supporting the rebound to test upside resistance zones.
3. STRATEGIC OUTLOOK FOR THE US SESSION:
• Resistance zone: 2,430 – 2,438 USDT (MA99 Zone)
• Support zone: 2,386 – 2,395 USDT (MA25 Zone) | Old bottom: 2,356 USDT
👉 TRADING SCENARIOS:
• Scenario 1 (LONG): If, at the beginning of the US session, the price Retests the 2,390 - 2,395 USDT area and forms a pullback candle (lower wick) -> Open a BUY/LONG position. Take-profit target: 2,435 USDT. Stoploss: Below 2,380 USDT.
• Scenario 2 (SHORT): If the price pushes up to the 2,434 - 2,438 USDT resistance area, but buy volume exhausts and a reversal candle appears (Pinbar, bearish engulfing / strong bearish rejection) -> Open a SELL/SHORT position in line with the larger trend. Stoploss: Above 2,450 USDT.
⚠️ NOTE: The US session often sweeps both ends with strong volatility. Manage risk strictly and place a complete Stoploss before major macro news is released.
$ETH