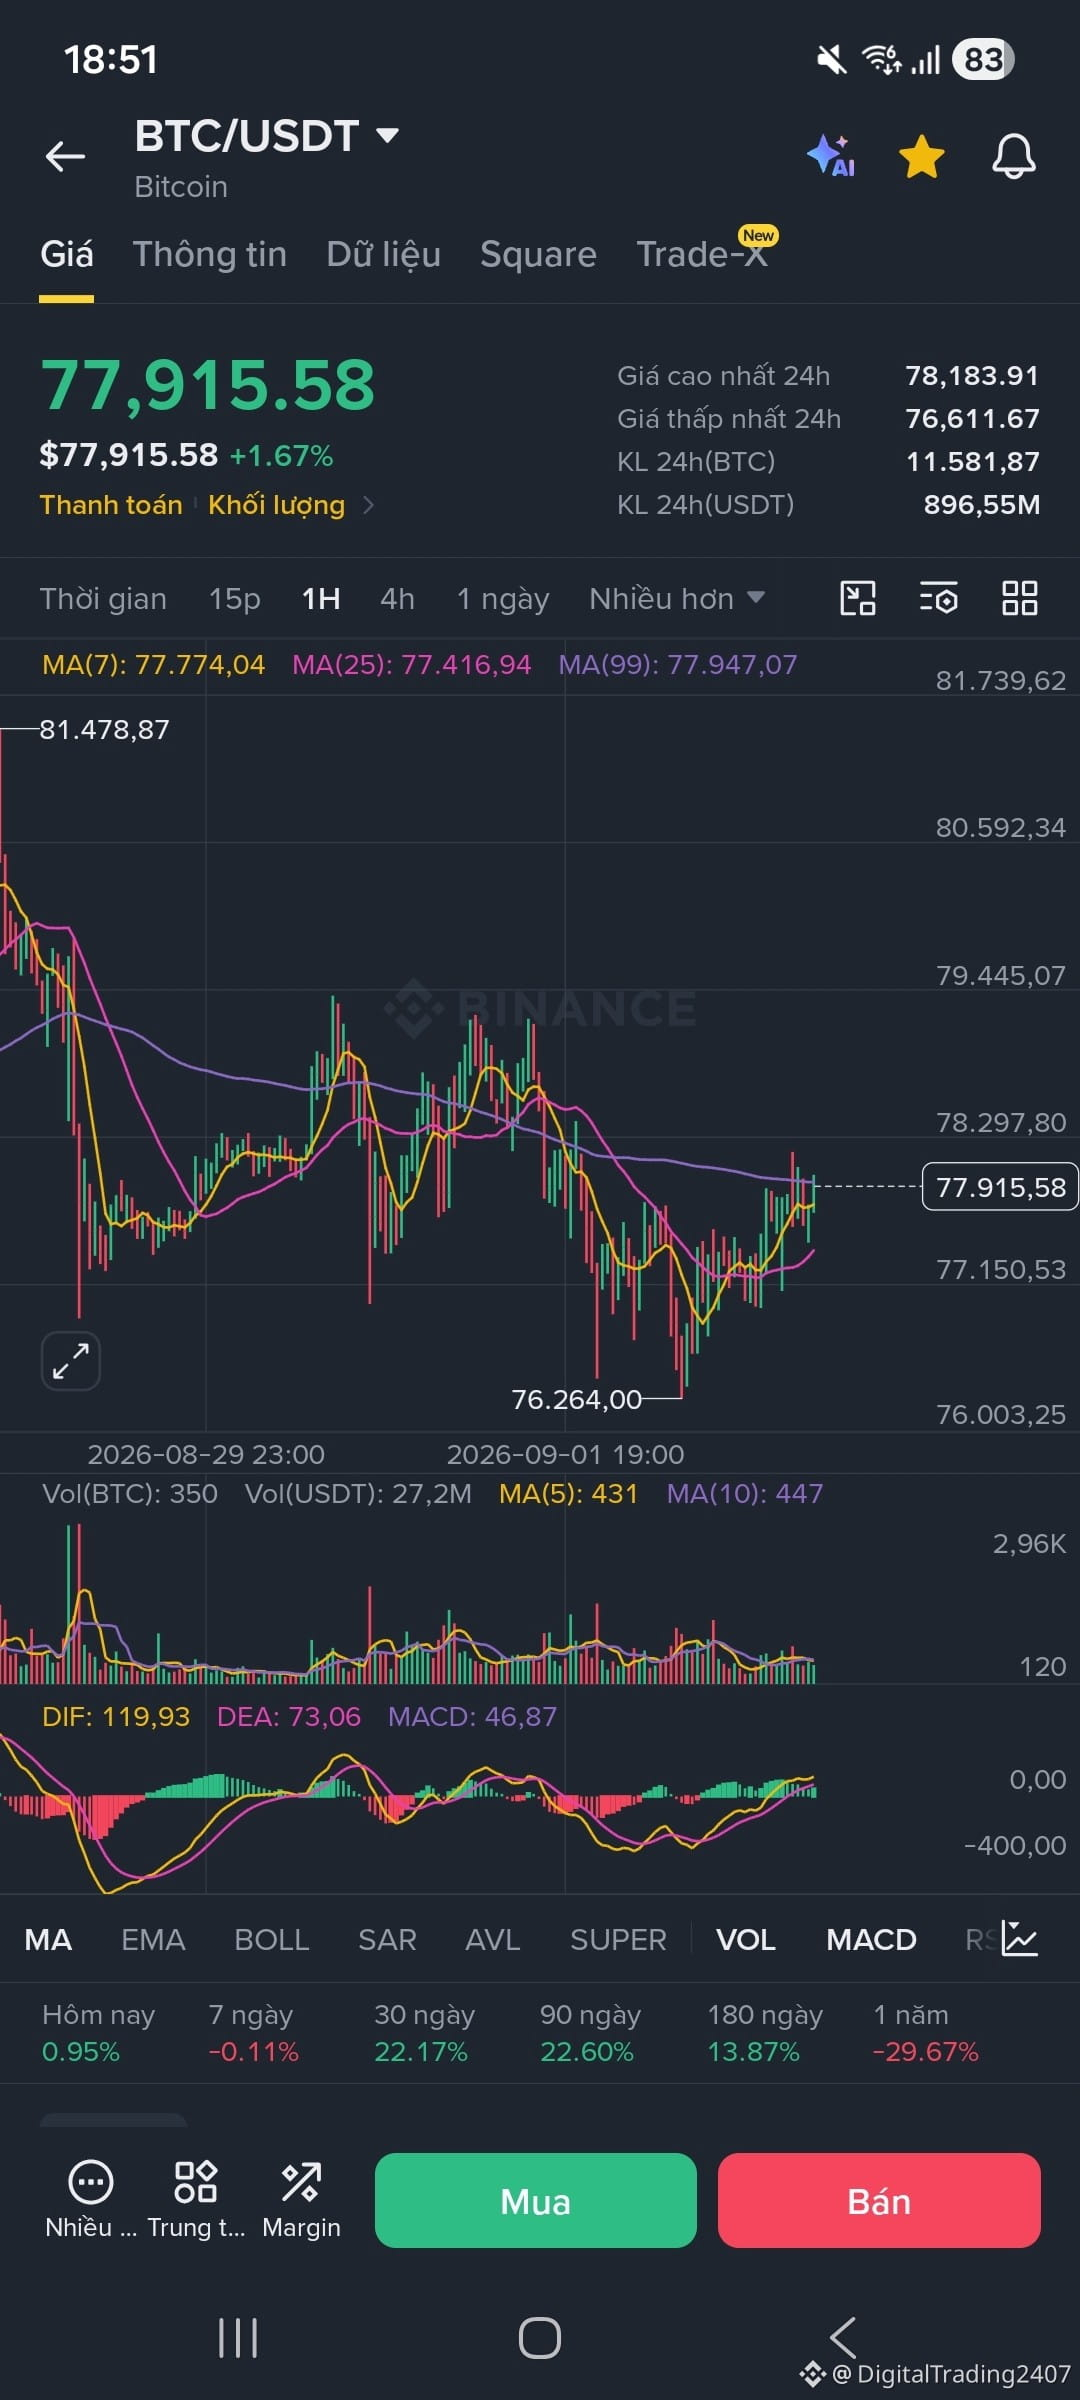
BTC/USDT 1H CHART ANALYSIS - EUROPEAN SESSION AND US SESSION OUTLOOK
1. OVERALL ASSESSMENT OF THE EUROPEAN SESSION
* Price trend: Mild recovery and consolidation from the 76,264.00 USDT bottom. Currently, price is moving around 77,915.58 USDT (+1.67%).
* Moving averages (MA): Price is above MA(7) and MA(25), indicating short-term recovery momentum, but it is being capped just below by MA(99) at 77,947.07.
* Volume: Liquidity is at a moderate level; there has been no breakout or strong surge from the buyers.
* MACD indicator: DIF crosses above DEA, signaling a technical rebound. The green Histogram bars are starting to appear, but momentum is still weak.
2. KEY PRICE LEVELS TO WATCH
* Near resistance: 78,000 to 78,300 USDT (old 24h high and MA99 resistance)
* Near support: 77,150 to 77,400 USDT (MA25 buffer zone)
* Hard support: 76,264 USDT (the session’s lowest low)
3. SCENARIOS AND TRADING DIRECTION FOR THE US SESSION
PREFERRED LONG SCENARIO
* Condition: Price breaks out and closes firmly on the 1H timeframe ABOVE 78,000 USDT with significant buying Volume.
* Strategy: Open a LONG position.
* Target TP: 79,400 USDT, then toward 80,500 USDT, toward 81,478 USDT.
PREFERRED SHORT SCENARIO
* Condition: Price is rejected in the 77,950 - 78,100 USDT area, with a long-wick candle or a bearish reversal, and the 77,400 USDT support level is lost.
* Strategy: Open a SHORT position.
* Target TP: 76,264 USDT, then toward 75,500 USDT.
Note: The US session often brings strong volatility and can sweep both ends. Always follow risk management and set a proper Stop Loss to cut losses!
$BTC
1. OVERALL ASSESSMENT OF THE EUROPEAN SESSION
* Price trend: Mild recovery and consolidation from the 76,264.00 USDT bottom. Currently, price is moving around 77,915.58 USDT (+1.67%).
* Moving averages (MA): Price is above MA(7) and MA(25), indicating short-term recovery momentum, but it is being capped just below by MA(99) at 77,947.07.
* Volume: Liquidity is at a moderate level; there has been no breakout or strong surge from the buyers.
* MACD indicator: DIF crosses above DEA, signaling a technical rebound. The green Histogram bars are starting to appear, but momentum is still weak.
2. KEY PRICE LEVELS TO WATCH
* Near resistance: 78,000 to 78,300 USDT (old 24h high and MA99 resistance)
* Near support: 77,150 to 77,400 USDT (MA25 buffer zone)
* Hard support: 76,264 USDT (the session’s lowest low)
3. SCENARIOS AND TRADING DIRECTION FOR THE US SESSION
PREFERRED LONG SCENARIO
* Condition: Price breaks out and closes firmly on the 1H timeframe ABOVE 78,000 USDT with significant buying Volume.
* Strategy: Open a LONG position.
* Target TP: 79,400 USDT, then toward 80,500 USDT, toward 81,478 USDT.
PREFERRED SHORT SCENARIO
* Condition: Price is rejected in the 77,950 - 78,100 USDT area, with a long-wick candle or a bearish reversal, and the 77,400 USDT support level is lost.
* Strategy: Open a SHORT position.
* Target TP: 76,264 USDT, then toward 75,500 USDT.
Note: The US session often brings strong volatility and can sweep both ends. Always follow risk management and set a proper Stop Loss to cut losses!
$BTC