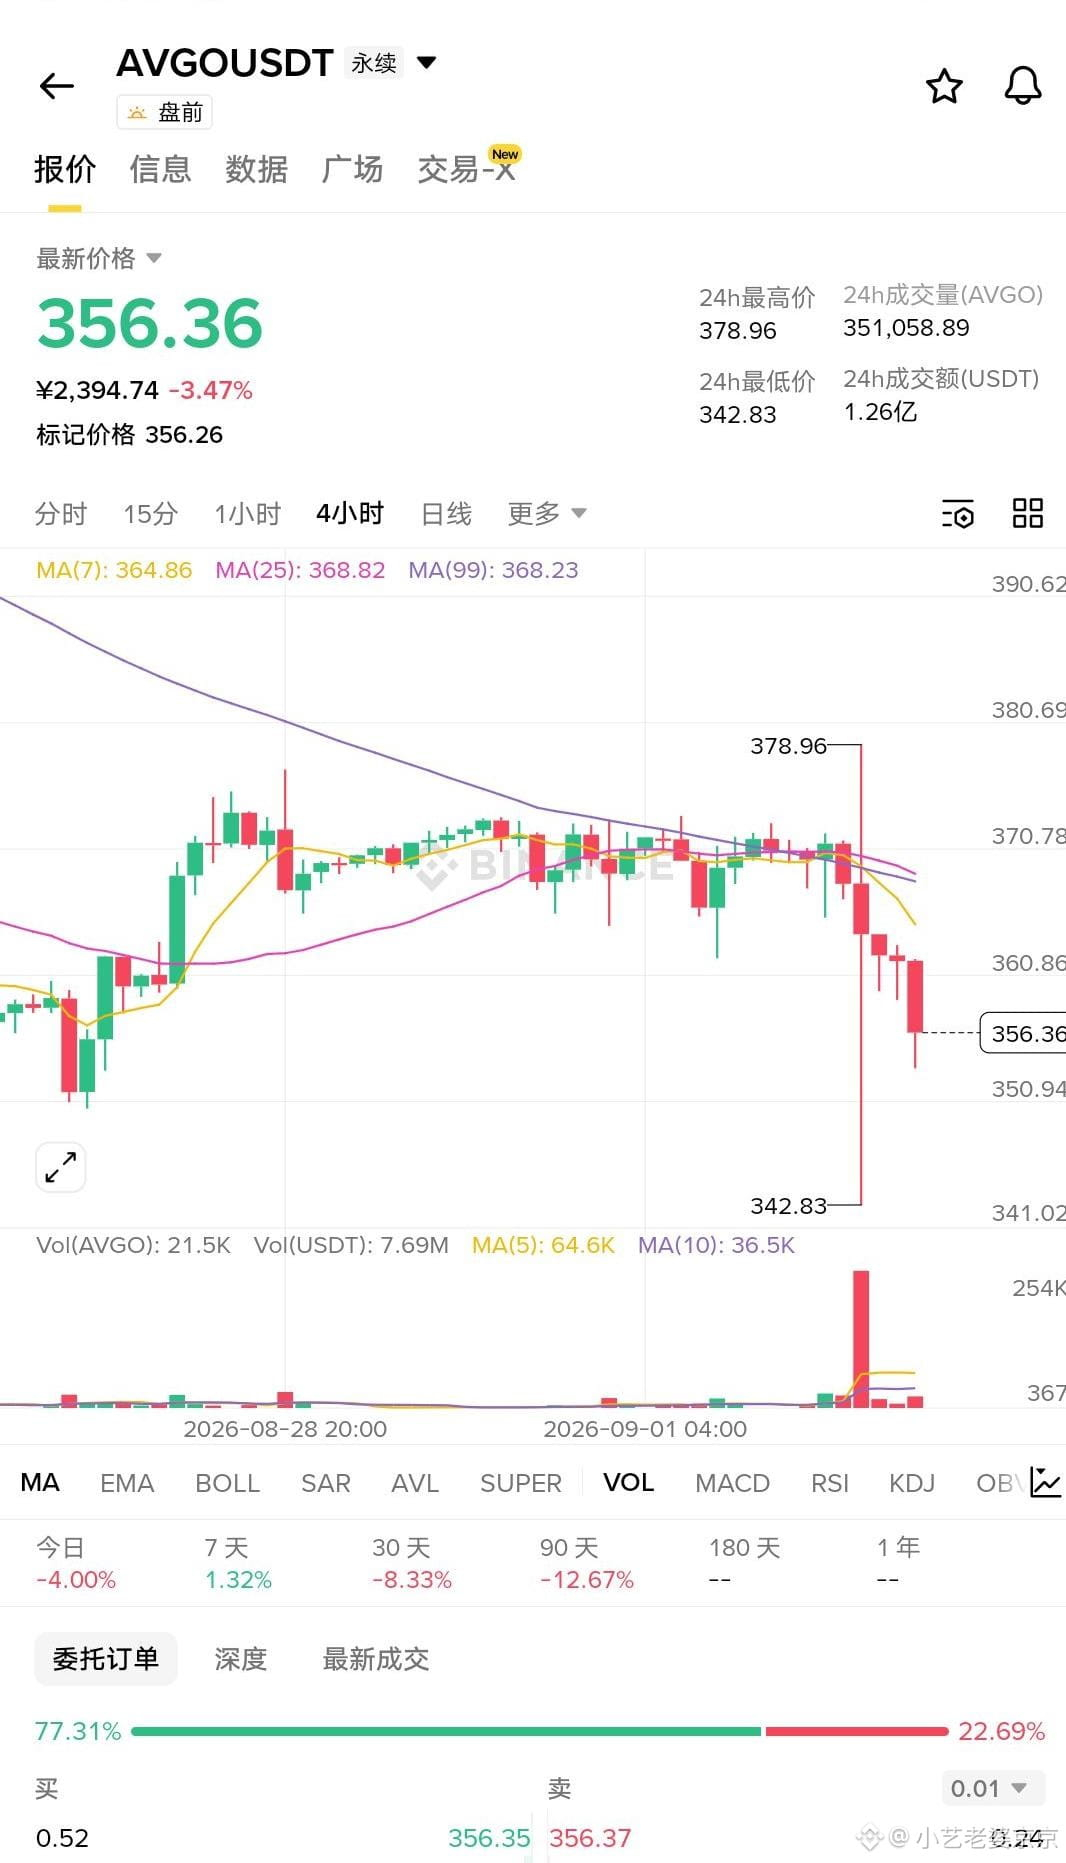
AVGO moving averages act as a ceiling—only go short, not more buys. The price is holding below the 20-line and 50-line and can’t lift its head. In the 4-hour chart, there’s a net drop of 3.75% with five bearish candles followed by one bullish candle; the daily chart is also moving down in sync. A break lower is a buyback/acceleration signal. Short on the pullback at 360.8. First target: 342.8, to test the 24-hour low. If it breaks above 380, exit the trade and stand down.

Post

--
Disclaimer: Includes third-party opinions. No advice. Binance AI may be used without guarantee. See T&Cs.