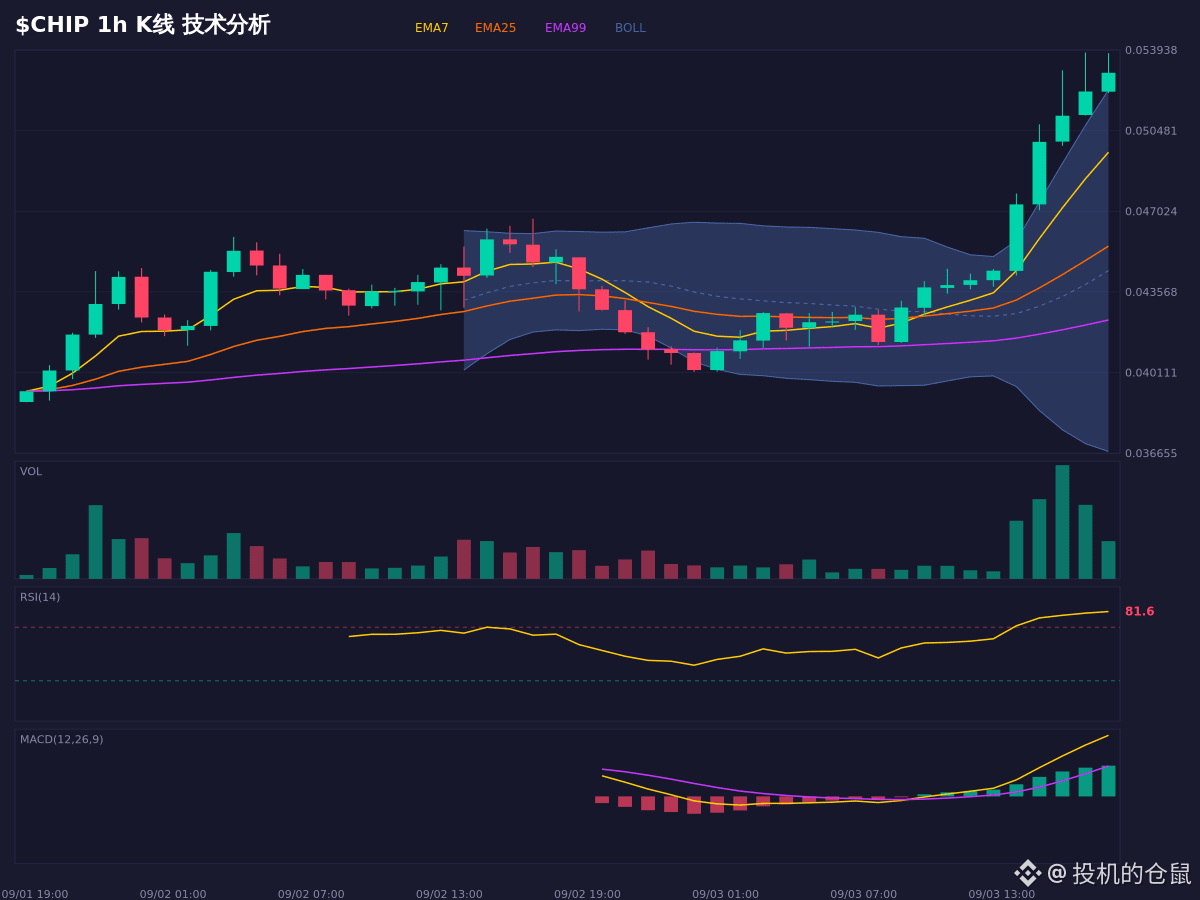
$CHIP This pump is a bit crazy—up from 0.04 to 0.053, in less than a day, about 30%. The two most striking numbers on the chart are the RSI: 81.8 on the 1-hour and 73.4 on the 4-hour—way overbought, folks! This indicator tops out at around 100, and it’s basically about to hit the ceiling already.
That said, the moving averages look really nice. EMA7, 25, and 99 are lined up in a row and crawling upward—bullish structure is holding steady. Even more impressive is the OBV energy tide: the money flow keeps pushing in, never really paused.
This creates a contradiction. On one hand, the trend is so strong and the capital is so aggressive; on the other, it’s so severely overbought that a pullback could happen at any time.
If it can hold the 0.0486–0.0506 range, the bullish structure can likely continue. But if it breaks below 0.04448, then the current logic fails. I really can’t recommend chasing. Whoever chases will know the pain.
For chart observation and scenario planning only—does not constitute a trading instruction or execution record.
$CHIP #熊市 #合约 #Market analysis
That said, the moving averages look really nice. EMA7, 25, and 99 are lined up in a row and crawling upward—bullish structure is holding steady. Even more impressive is the OBV energy tide: the money flow keeps pushing in, never really paused.
This creates a contradiction. On one hand, the trend is so strong and the capital is so aggressive; on the other, it’s so severely overbought that a pullback could happen at any time.
If it can hold the 0.0486–0.0506 range, the bullish structure can likely continue. But if it breaks below 0.04448, then the current logic fails. I really can’t recommend chasing. Whoever chases will know the pain.
For chart observation and scenario planning only—does not constitute a trading instruction or execution record.
$CHIP #熊市 #合约 #Market analysis