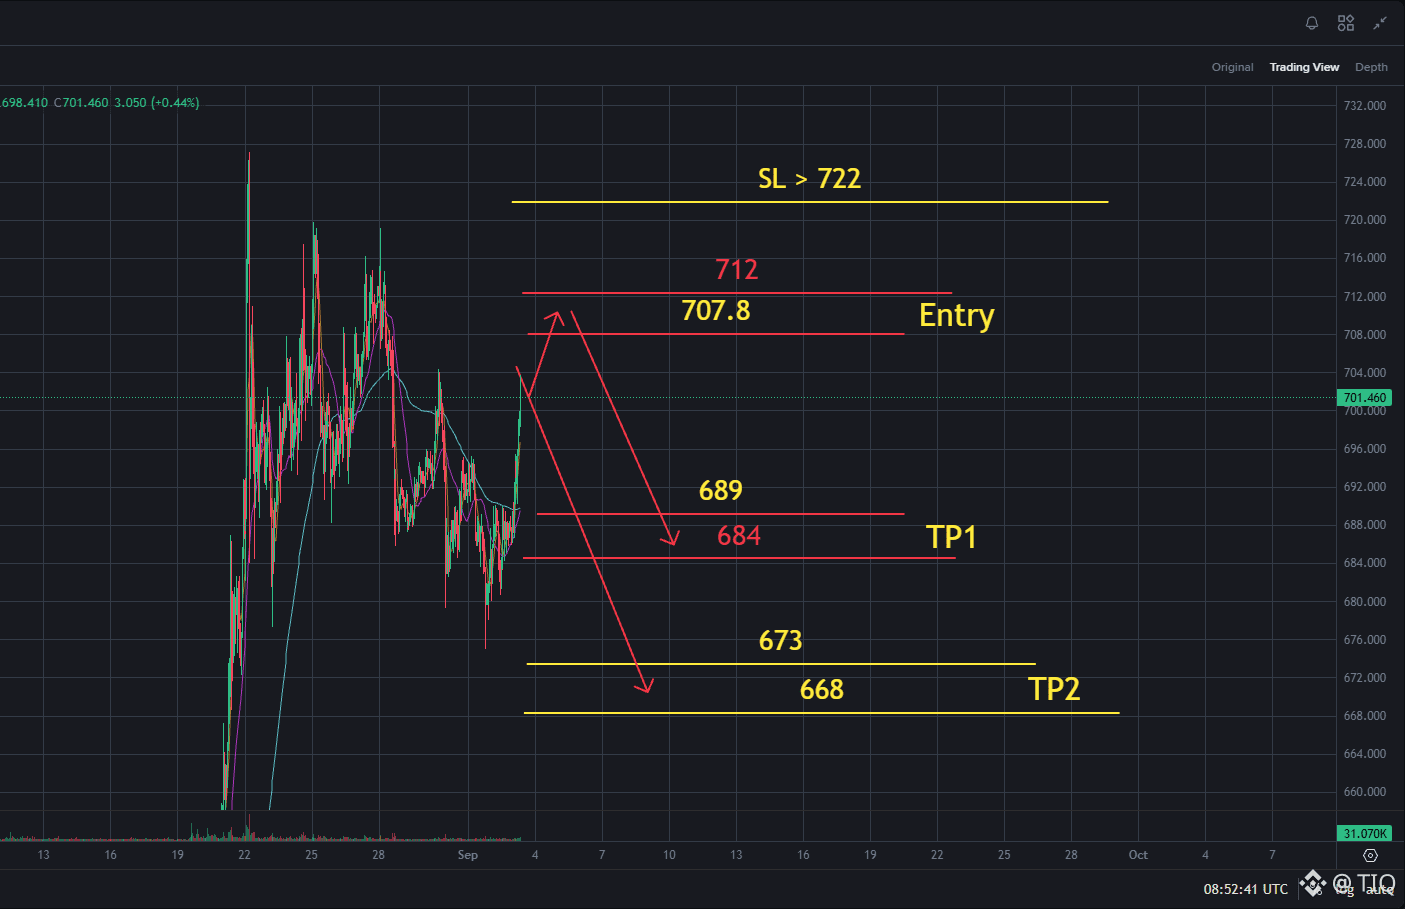
$BNB Price is currently trading around 701.46 (+0.44% showing a mild recovery push). On the H1 chart, the overall structure remains corrective following a strong breakdown from recent tops. The current price action is forming a temporary relief bounce up to test overhead resistance before resuming its primary downtrend toward lower support targets.
📌 Trading Plan (Short Setup):
💥 Short Entry Zone: 707.8 - 712
💥 Stop Loss (SL): > 722
🎯 Take Profit Targets:
🎉 TP1: 684 - 689
🎉 TP2: 668 - 673
👉 Following a sharp rejection at higher peak levels (~728), price established a sequence of lower highs and lower lows. The current green move represents a classic retest of the broken structural level and dynamic moving average resistance.
👉 The primary entry confluence lies between 707.8 and 712 Looking for a rejection inside this resistance zone provides an optimal risk-to-reward ratio for Short positioning.
👉 Key Invalidation (SL): A clean push and candle close above 722 invalidates this Short setup, indicating a potential reversal back to bullish structural control.
Click here to view the chart 👇️👇👇
📌 Trading Plan (Short Setup):
💥 Short Entry Zone: 707.8 - 712
💥 Stop Loss (SL): > 722
🎯 Take Profit Targets:
🎉 TP1: 684 - 689
🎉 TP2: 668 - 673
👉 Following a sharp rejection at higher peak levels (~728), price established a sequence of lower highs and lower lows. The current green move represents a classic retest of the broken structural level and dynamic moving average resistance.
👉 The primary entry confluence lies between 707.8 and 712 Looking for a rejection inside this resistance zone provides an optimal risk-to-reward ratio for Short positioning.
👉 Key Invalidation (SL): A clean push and candle close above 722 invalidates this Short setup, indicating a potential reversal back to bullish structural control.
Click here to view the chart 👇️👇👇