BTR ANJLOK -20%! ALREADY AT THE BOTTOM OR WILL IT KEEP FALLING? ⚠️
ANALYSIS:
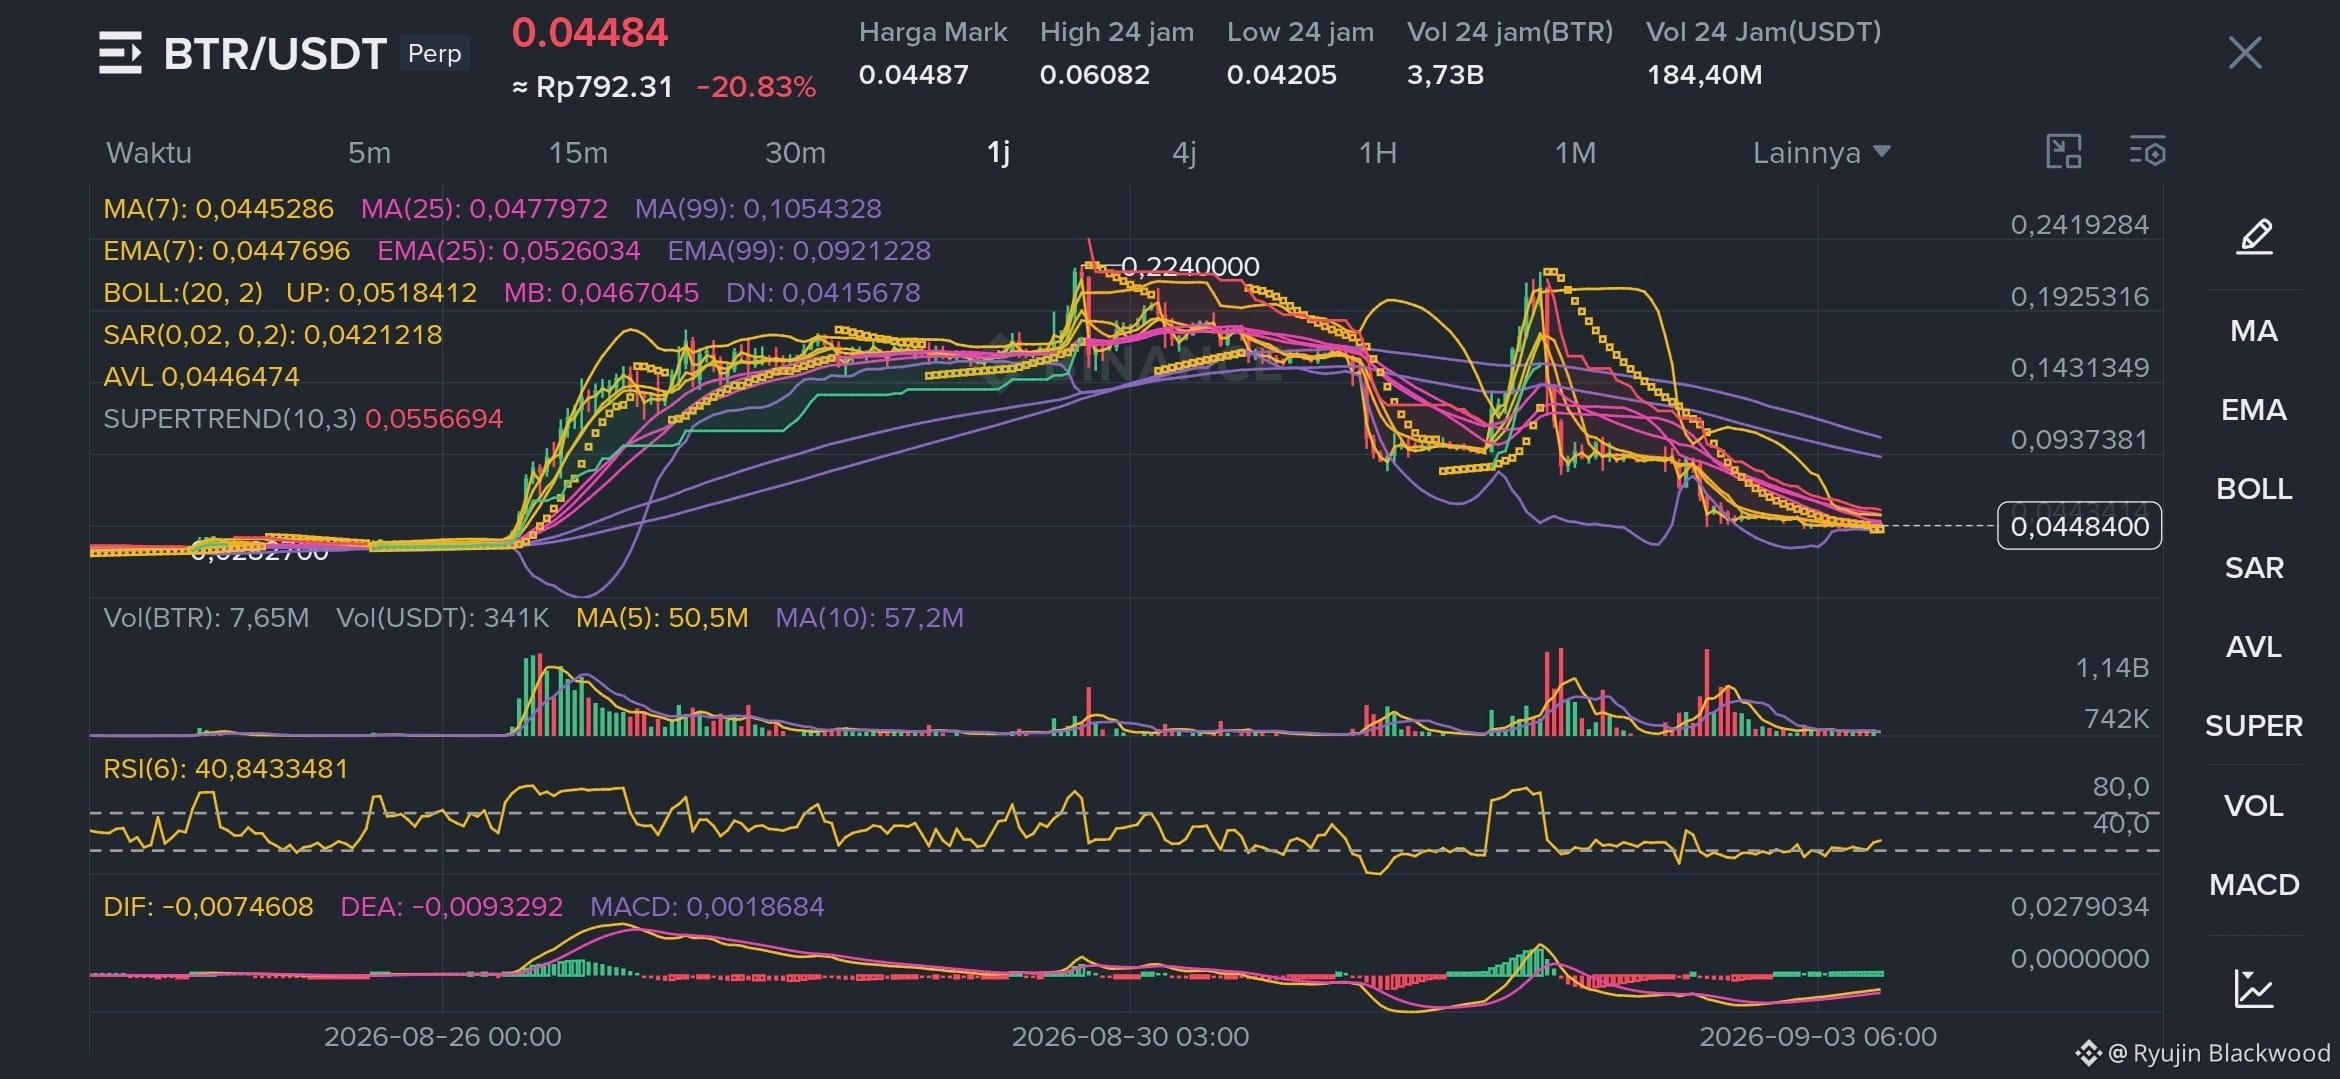
BTR/USDT on the 1-hour timeframe is still in a strong bearish structure after a long decline from the peak around 0.2240. Price is now around 0.04484, down -20.83% in 24 hours. Although selling pressure has started to ease, a truly confirmed trend reversal has not yet been seen.
Price is still below the MA25 at 0.0478 and far below the MA99 at 0.1054. The EMA25 at 0.0526 and the Supertrend around 0.0557 are also above the price, making that area an important resistance that buyers must reclaim.
RSI(6) is at 40.84, indicating bearish momentum is starting to cool but has not entered the bullish zone yet. Interestingly, the MACD is beginning to show signs of recovery: DIF -0.00746 is above DEA -0.00933 with a positive histogram. This creates an opportunity for a short-term technical rebound.
The main support is at 0.0420–0.0415. If that level breaks, the price risks moving toward 0.038–0.035. Resistance is at 0.047–0.052, then 0.0557–0.0608.
In conclusion, BTR is still bearish, but it is starting to show signs of stabilization. Reclaiming 0.052–0.056 will strengthen the chance of a reversal, while a breakdown of 0.042 could potentially continue the downtrend.
$BTR
#Write2Earn #trading #BinanceSquare #BinanceSquareFamily #TechnicalAnalysis
ANALYSIS:
BTR/USDT on the 1-hour timeframe is still in a strong bearish structure after a long decline from the peak around 0.2240. Price is now around 0.04484, down -20.83% in 24 hours. Although selling pressure has started to ease, a truly confirmed trend reversal has not yet been seen.
Price is still below the MA25 at 0.0478 and far below the MA99 at 0.1054. The EMA25 at 0.0526 and the Supertrend around 0.0557 are also above the price, making that area an important resistance that buyers must reclaim.
RSI(6) is at 40.84, indicating bearish momentum is starting to cool but has not entered the bullish zone yet. Interestingly, the MACD is beginning to show signs of recovery: DIF -0.00746 is above DEA -0.00933 with a positive histogram. This creates an opportunity for a short-term technical rebound.
The main support is at 0.0420–0.0415. If that level breaks, the price risks moving toward 0.038–0.035. Resistance is at 0.047–0.052, then 0.0557–0.0608.
In conclusion, BTR is still bearish, but it is starting to show signs of stabilization. Reclaiming 0.052–0.056 will strengthen the chance of a reversal, while a breakdown of 0.042 could potentially continue the downtrend.
$BTR
#Write2Earn #trading #BinanceSquare #BinanceSquareFamily #TechnicalAnalysis