📈 BNB IN A KEY CONSOLIDATION ZONE: LOOKING FOR THE NEXT IMPULSE! ⚡
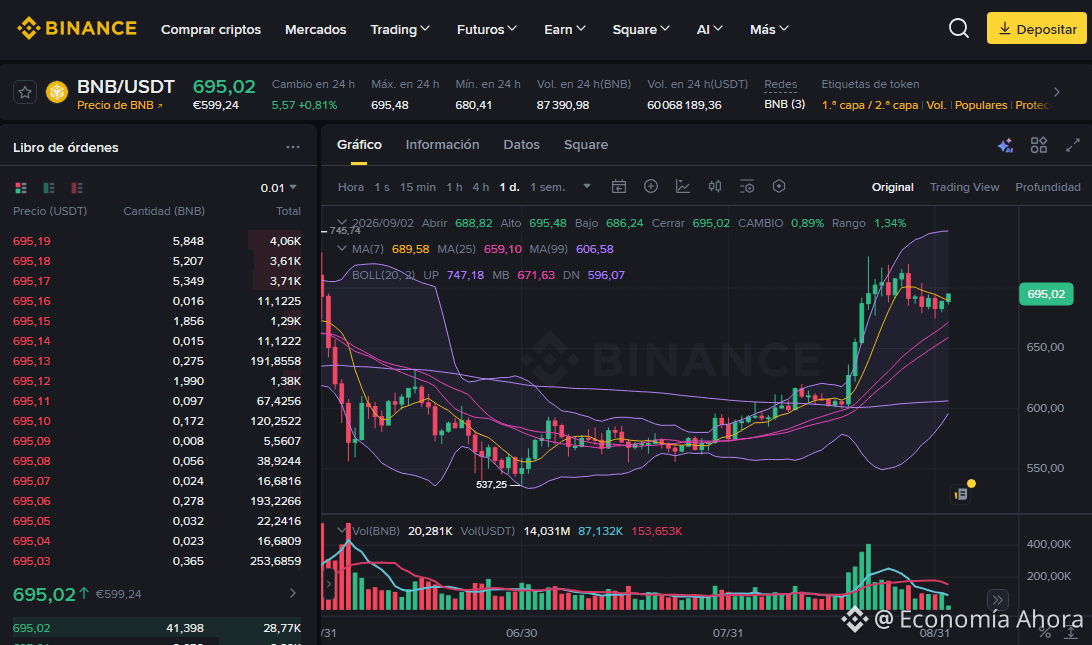
BNB/USDT’s daily chart shows a technical consolidation phase, trading at 695.02, which represents a +0.81% gain over the last 24 hours. Its daily operating range recorded a high of 695.48 and a low of 680.41, reflecting balance after testing areas near the recent highs.
🔍 Trend Analysis and Indicators
Trend: Bullish short-term consolidation. Price is moving around the fast moving average MA(7) (689.58), maintaining a solid and favorable structural distance versus MA(25) (659.10) and MA(99) (606.58).
Bollinger Bands: The quote stabilizes in the upper half of the channel, staying below the upper band at UP: 747.18. The middle line sits at MB: 671.63, and the lower line at DN: 596.07.
Structural Floor: The fundamental technical support of the previous base remains firmly at 537.25.
💡 Trading Strategy: Buy or Sell?
Buy (Long)?: This consolidation phase offers more prudent tactical entry options, avoiding chasing the price at absolute highs. Management: It’s essential to operate with proper risk management and a strict Stop Loss.
Sell (Short)?: A high-risk counter-trend trade, since the overall market structure continues to support buyers. It would only be considered if there is a clear loss of relevant supports.
#BNB #AnalisisTecnico #CryptoTrading
May the Lord bless and prosper the one who operates here, in the name of Jesus, because your word says: “Mine is the silver, and mine is the gold,” says the LORD of hosts. Hageo 2:8 RV1960-T -
$BNB
BNB/USDT’s daily chart shows a technical consolidation phase, trading at 695.02, which represents a +0.81% gain over the last 24 hours. Its daily operating range recorded a high of 695.48 and a low of 680.41, reflecting balance after testing areas near the recent highs.
🔍 Trend Analysis and Indicators
Trend: Bullish short-term consolidation. Price is moving around the fast moving average MA(7) (689.58), maintaining a solid and favorable structural distance versus MA(25) (659.10) and MA(99) (606.58).
Bollinger Bands: The quote stabilizes in the upper half of the channel, staying below the upper band at UP: 747.18. The middle line sits at MB: 671.63, and the lower line at DN: 596.07.
Structural Floor: The fundamental technical support of the previous base remains firmly at 537.25.
💡 Trading Strategy: Buy or Sell?
Buy (Long)?: This consolidation phase offers more prudent tactical entry options, avoiding chasing the price at absolute highs. Management: It’s essential to operate with proper risk management and a strict Stop Loss.
Sell (Short)?: A high-risk counter-trend trade, since the overall market structure continues to support buyers. It would only be considered if there is a clear loss of relevant supports.
#BNB #AnalisisTecnico #CryptoTrading
May the Lord bless and prosper the one who operates here, in the name of Jesus, because your word says: “Mine is the silver, and mine is the gold,” says the LORD of hosts. Hageo 2:8 RV1960-T -
$BNB