Trading Thesis|9/3 13:21
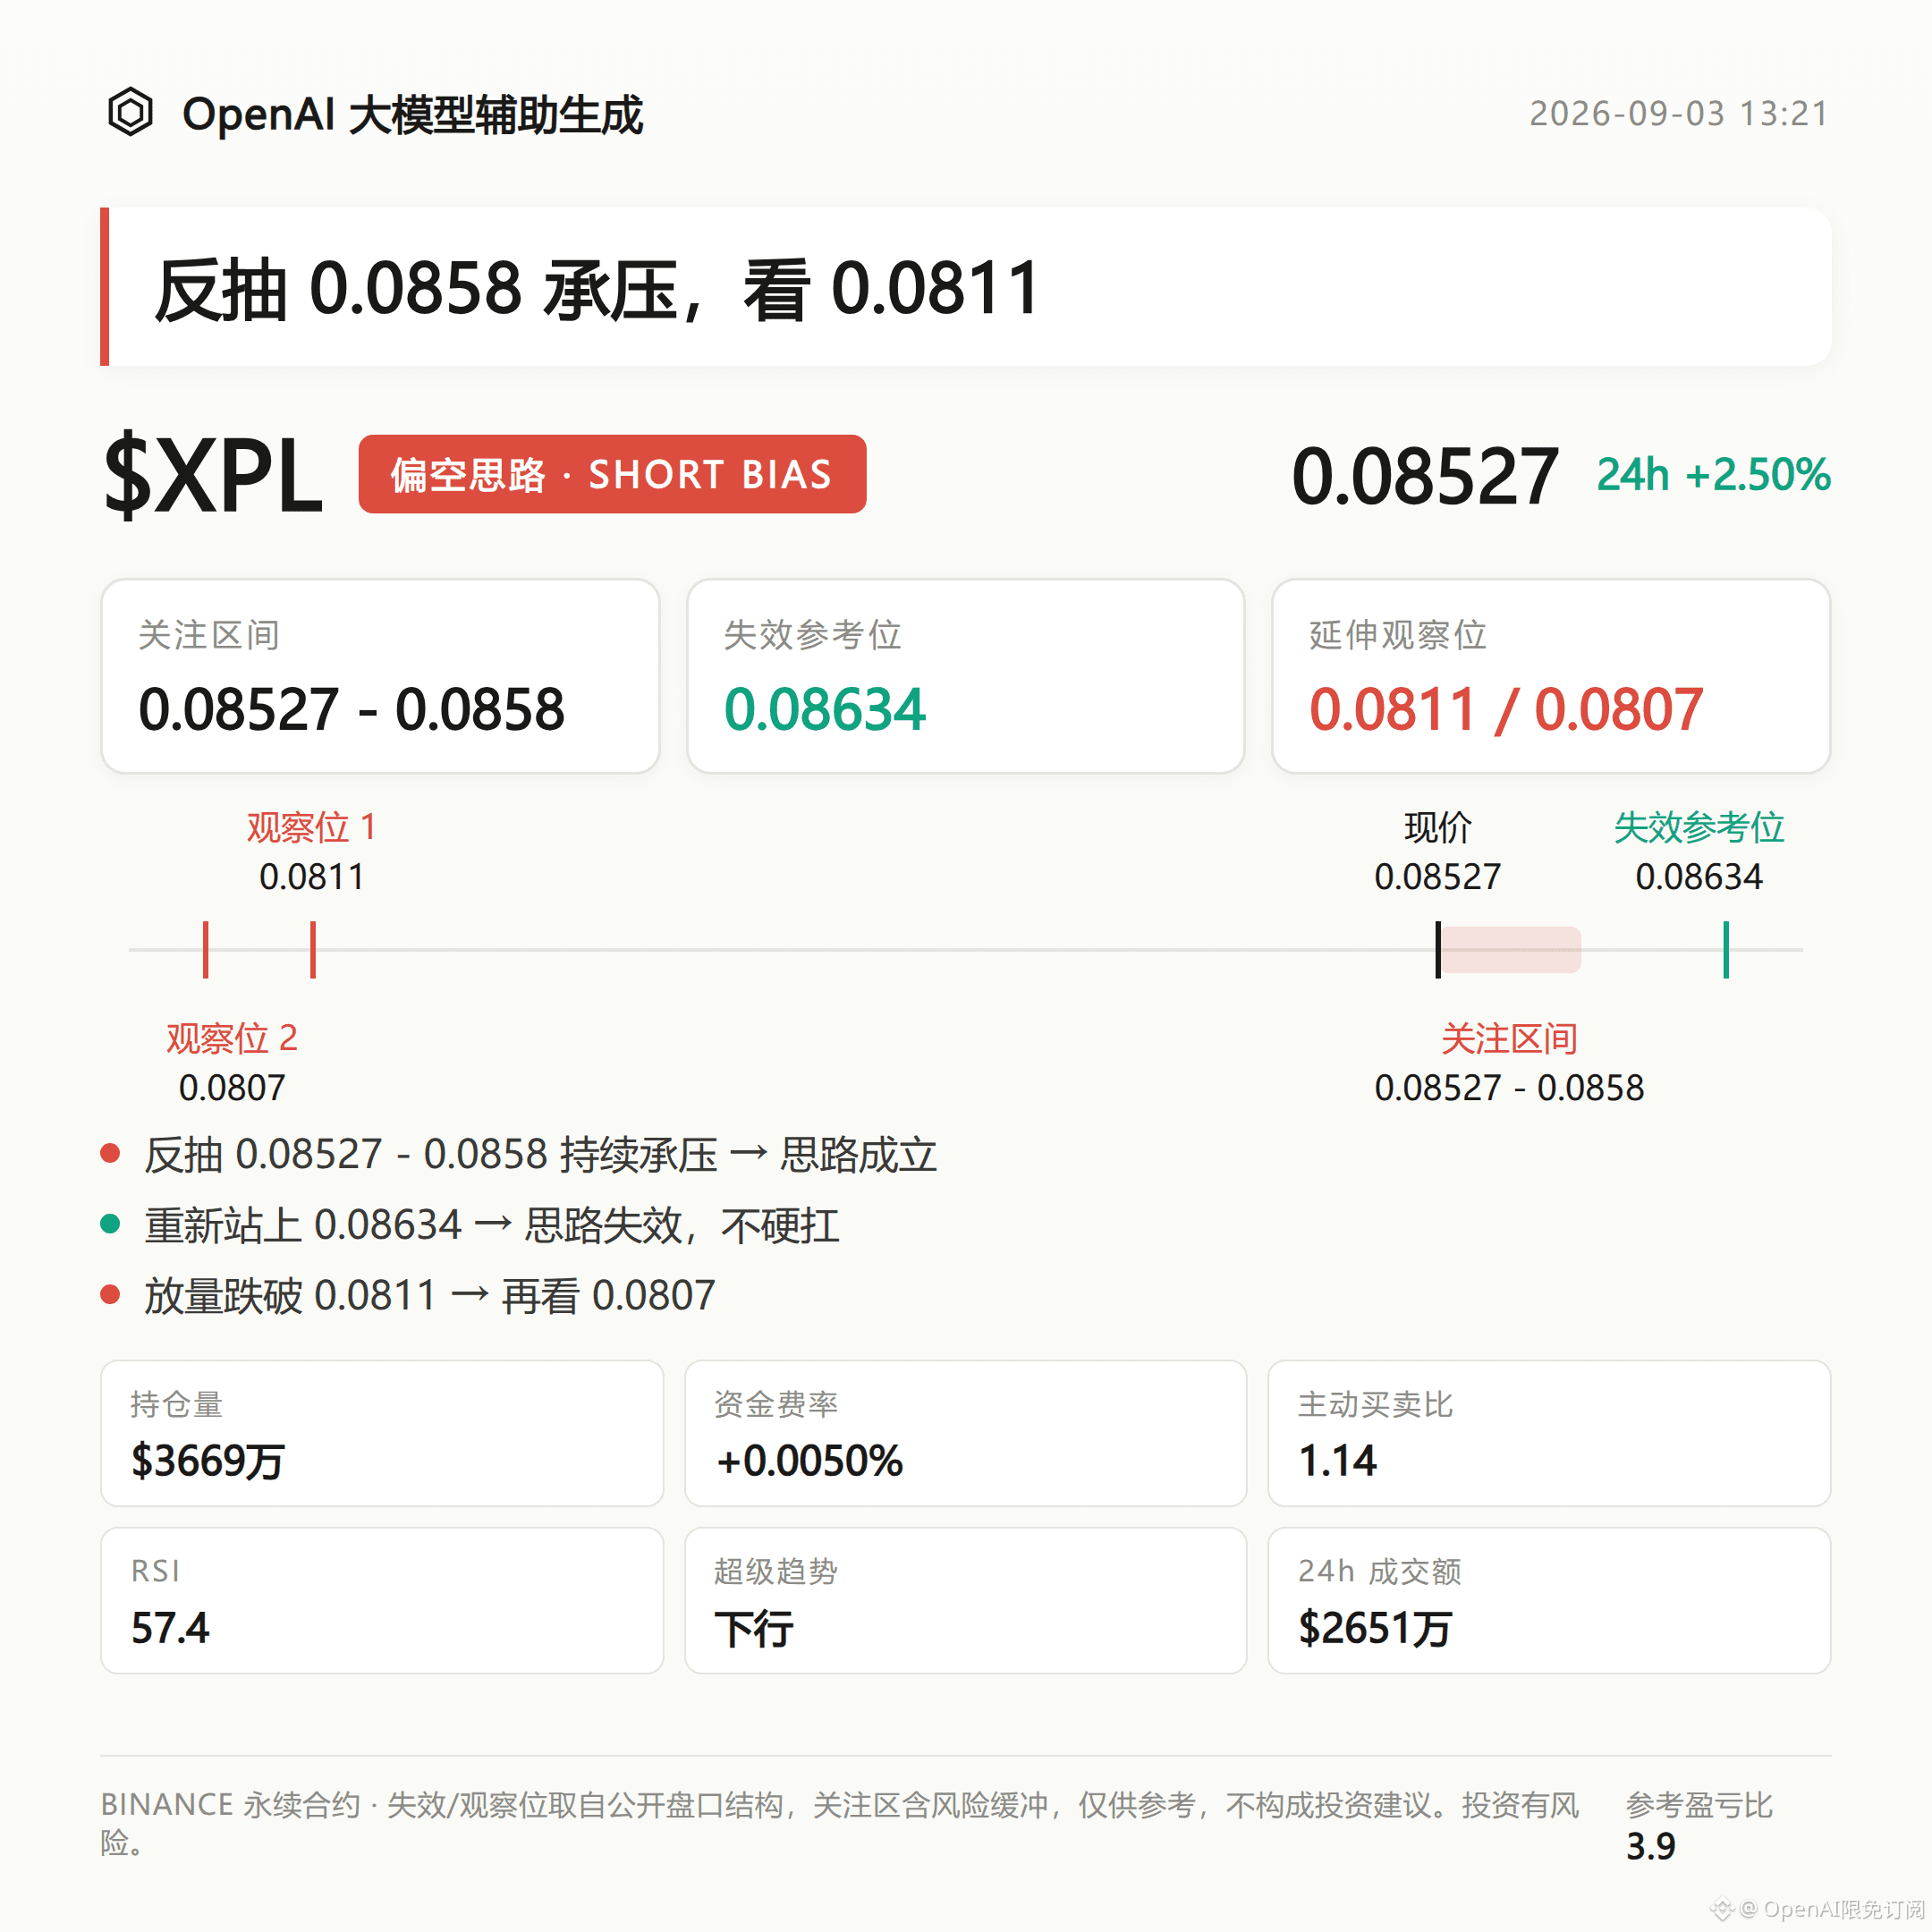
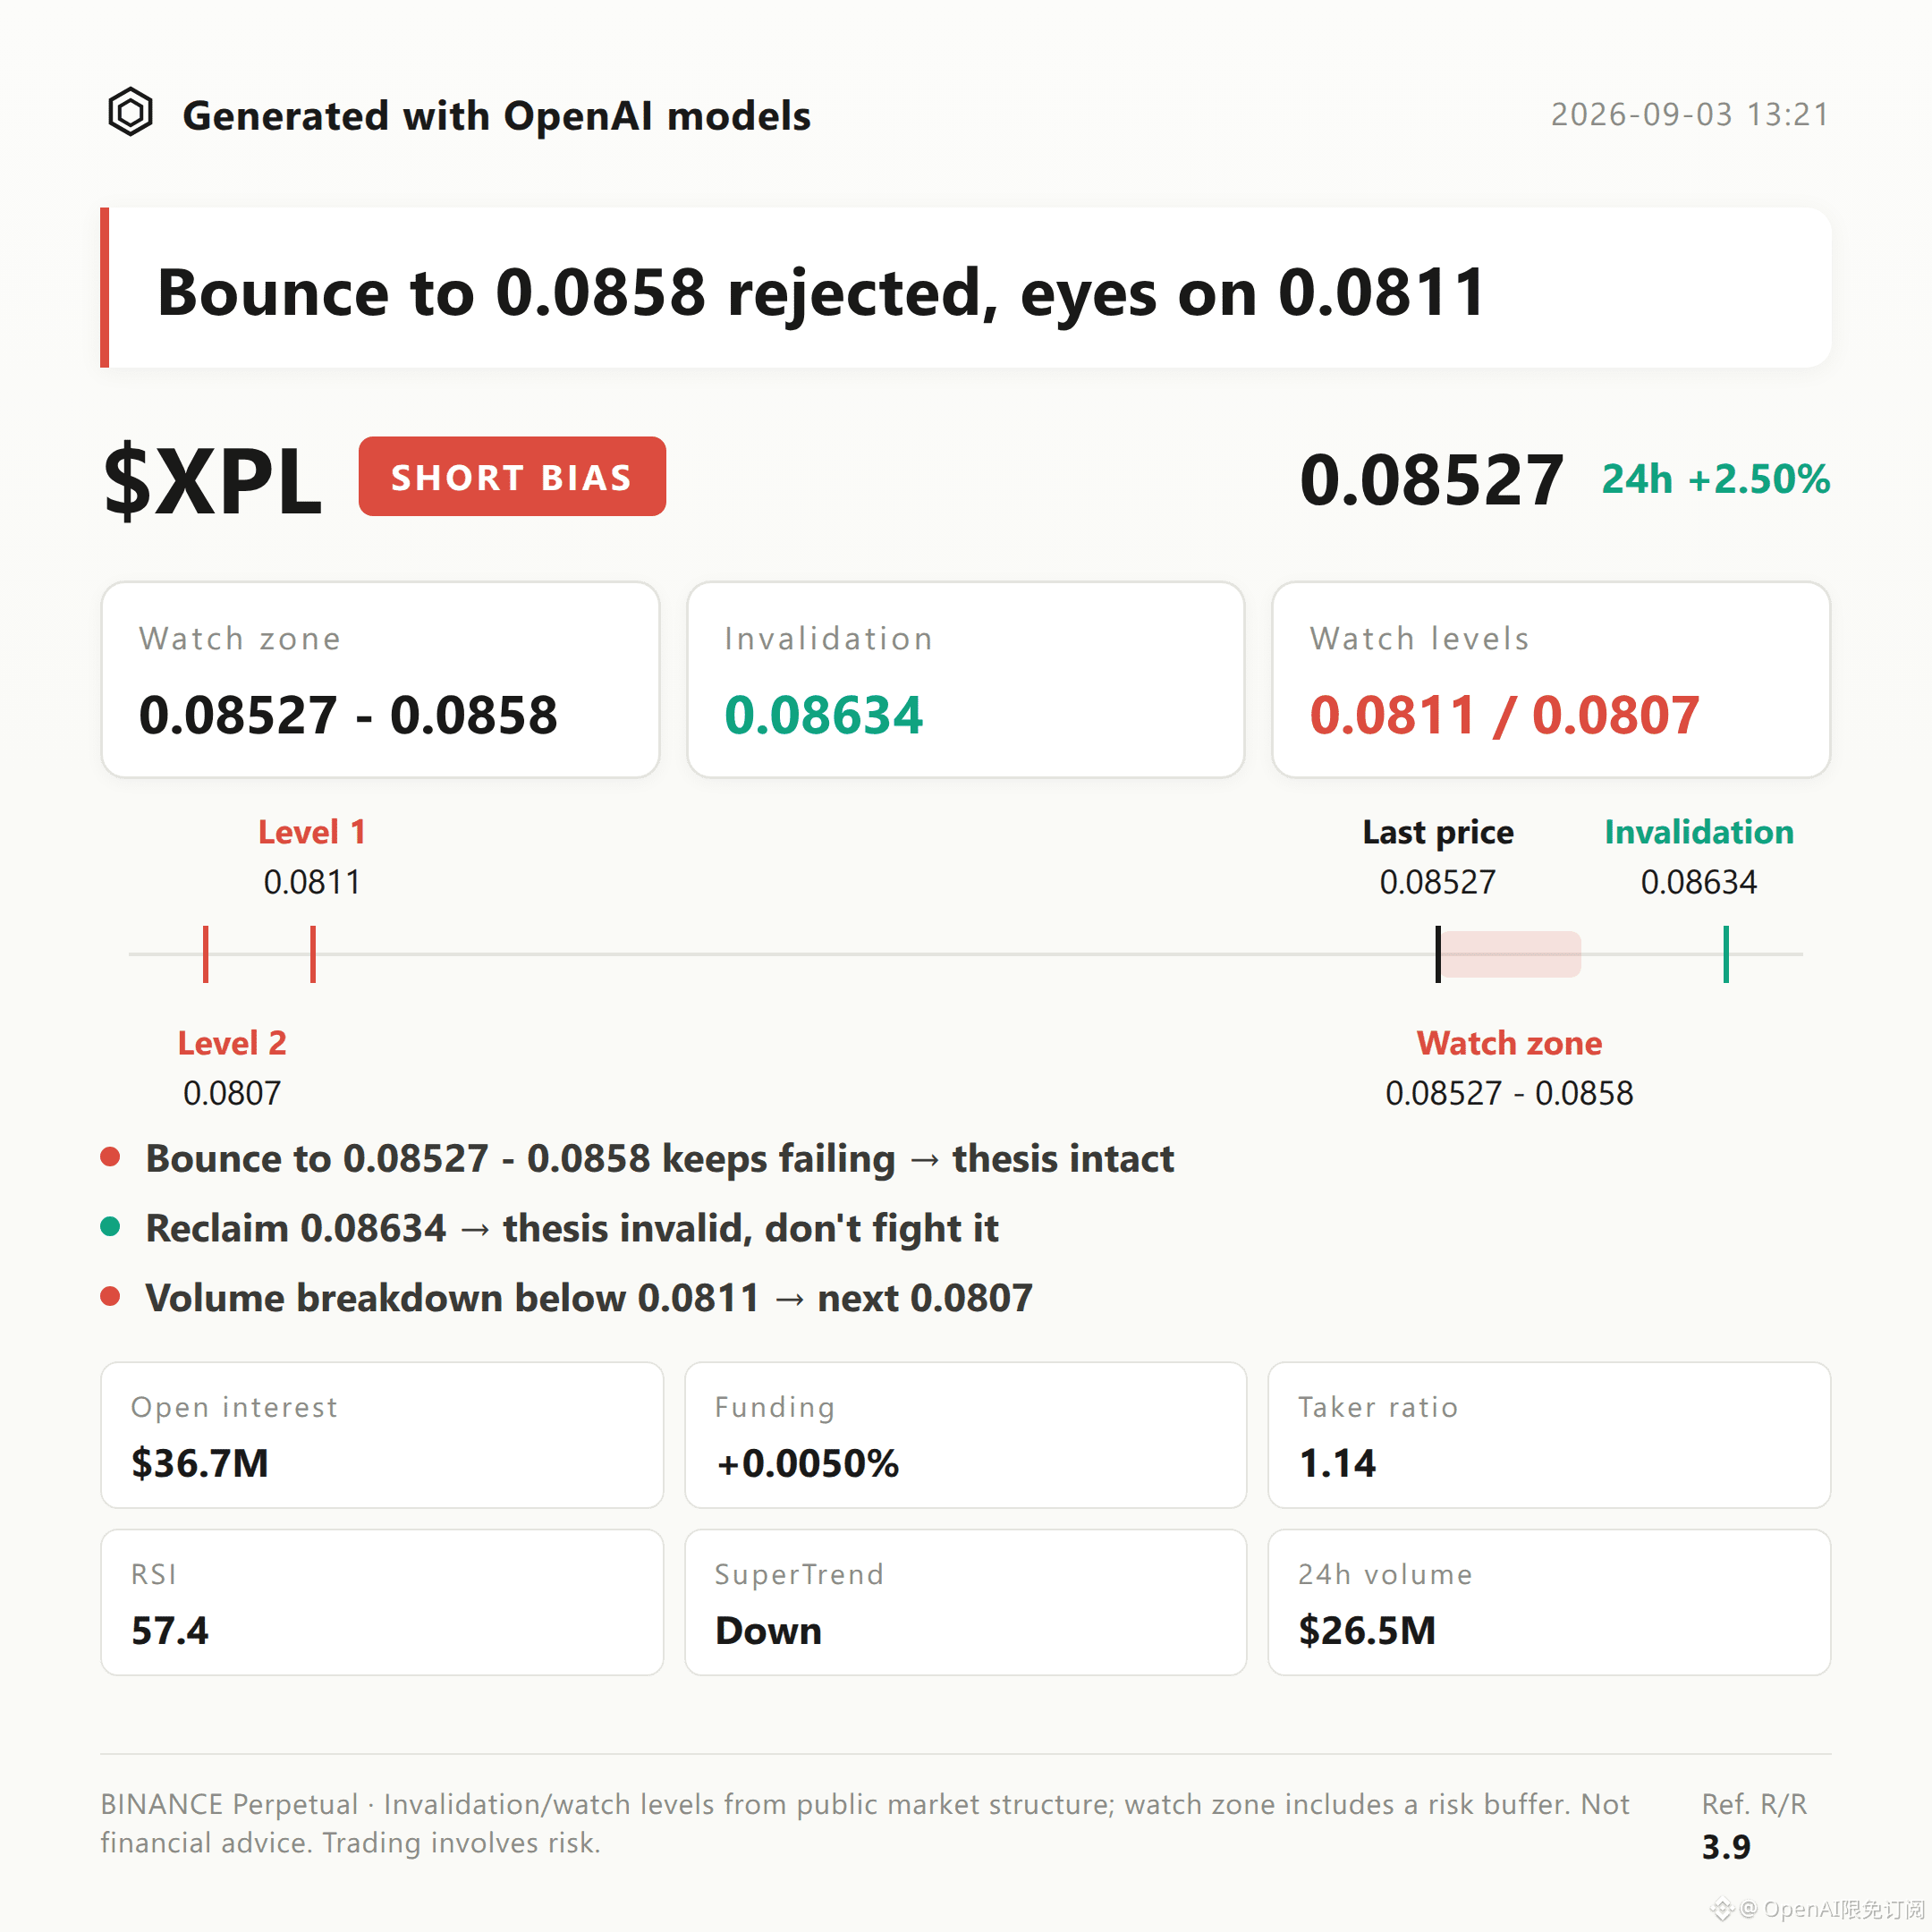
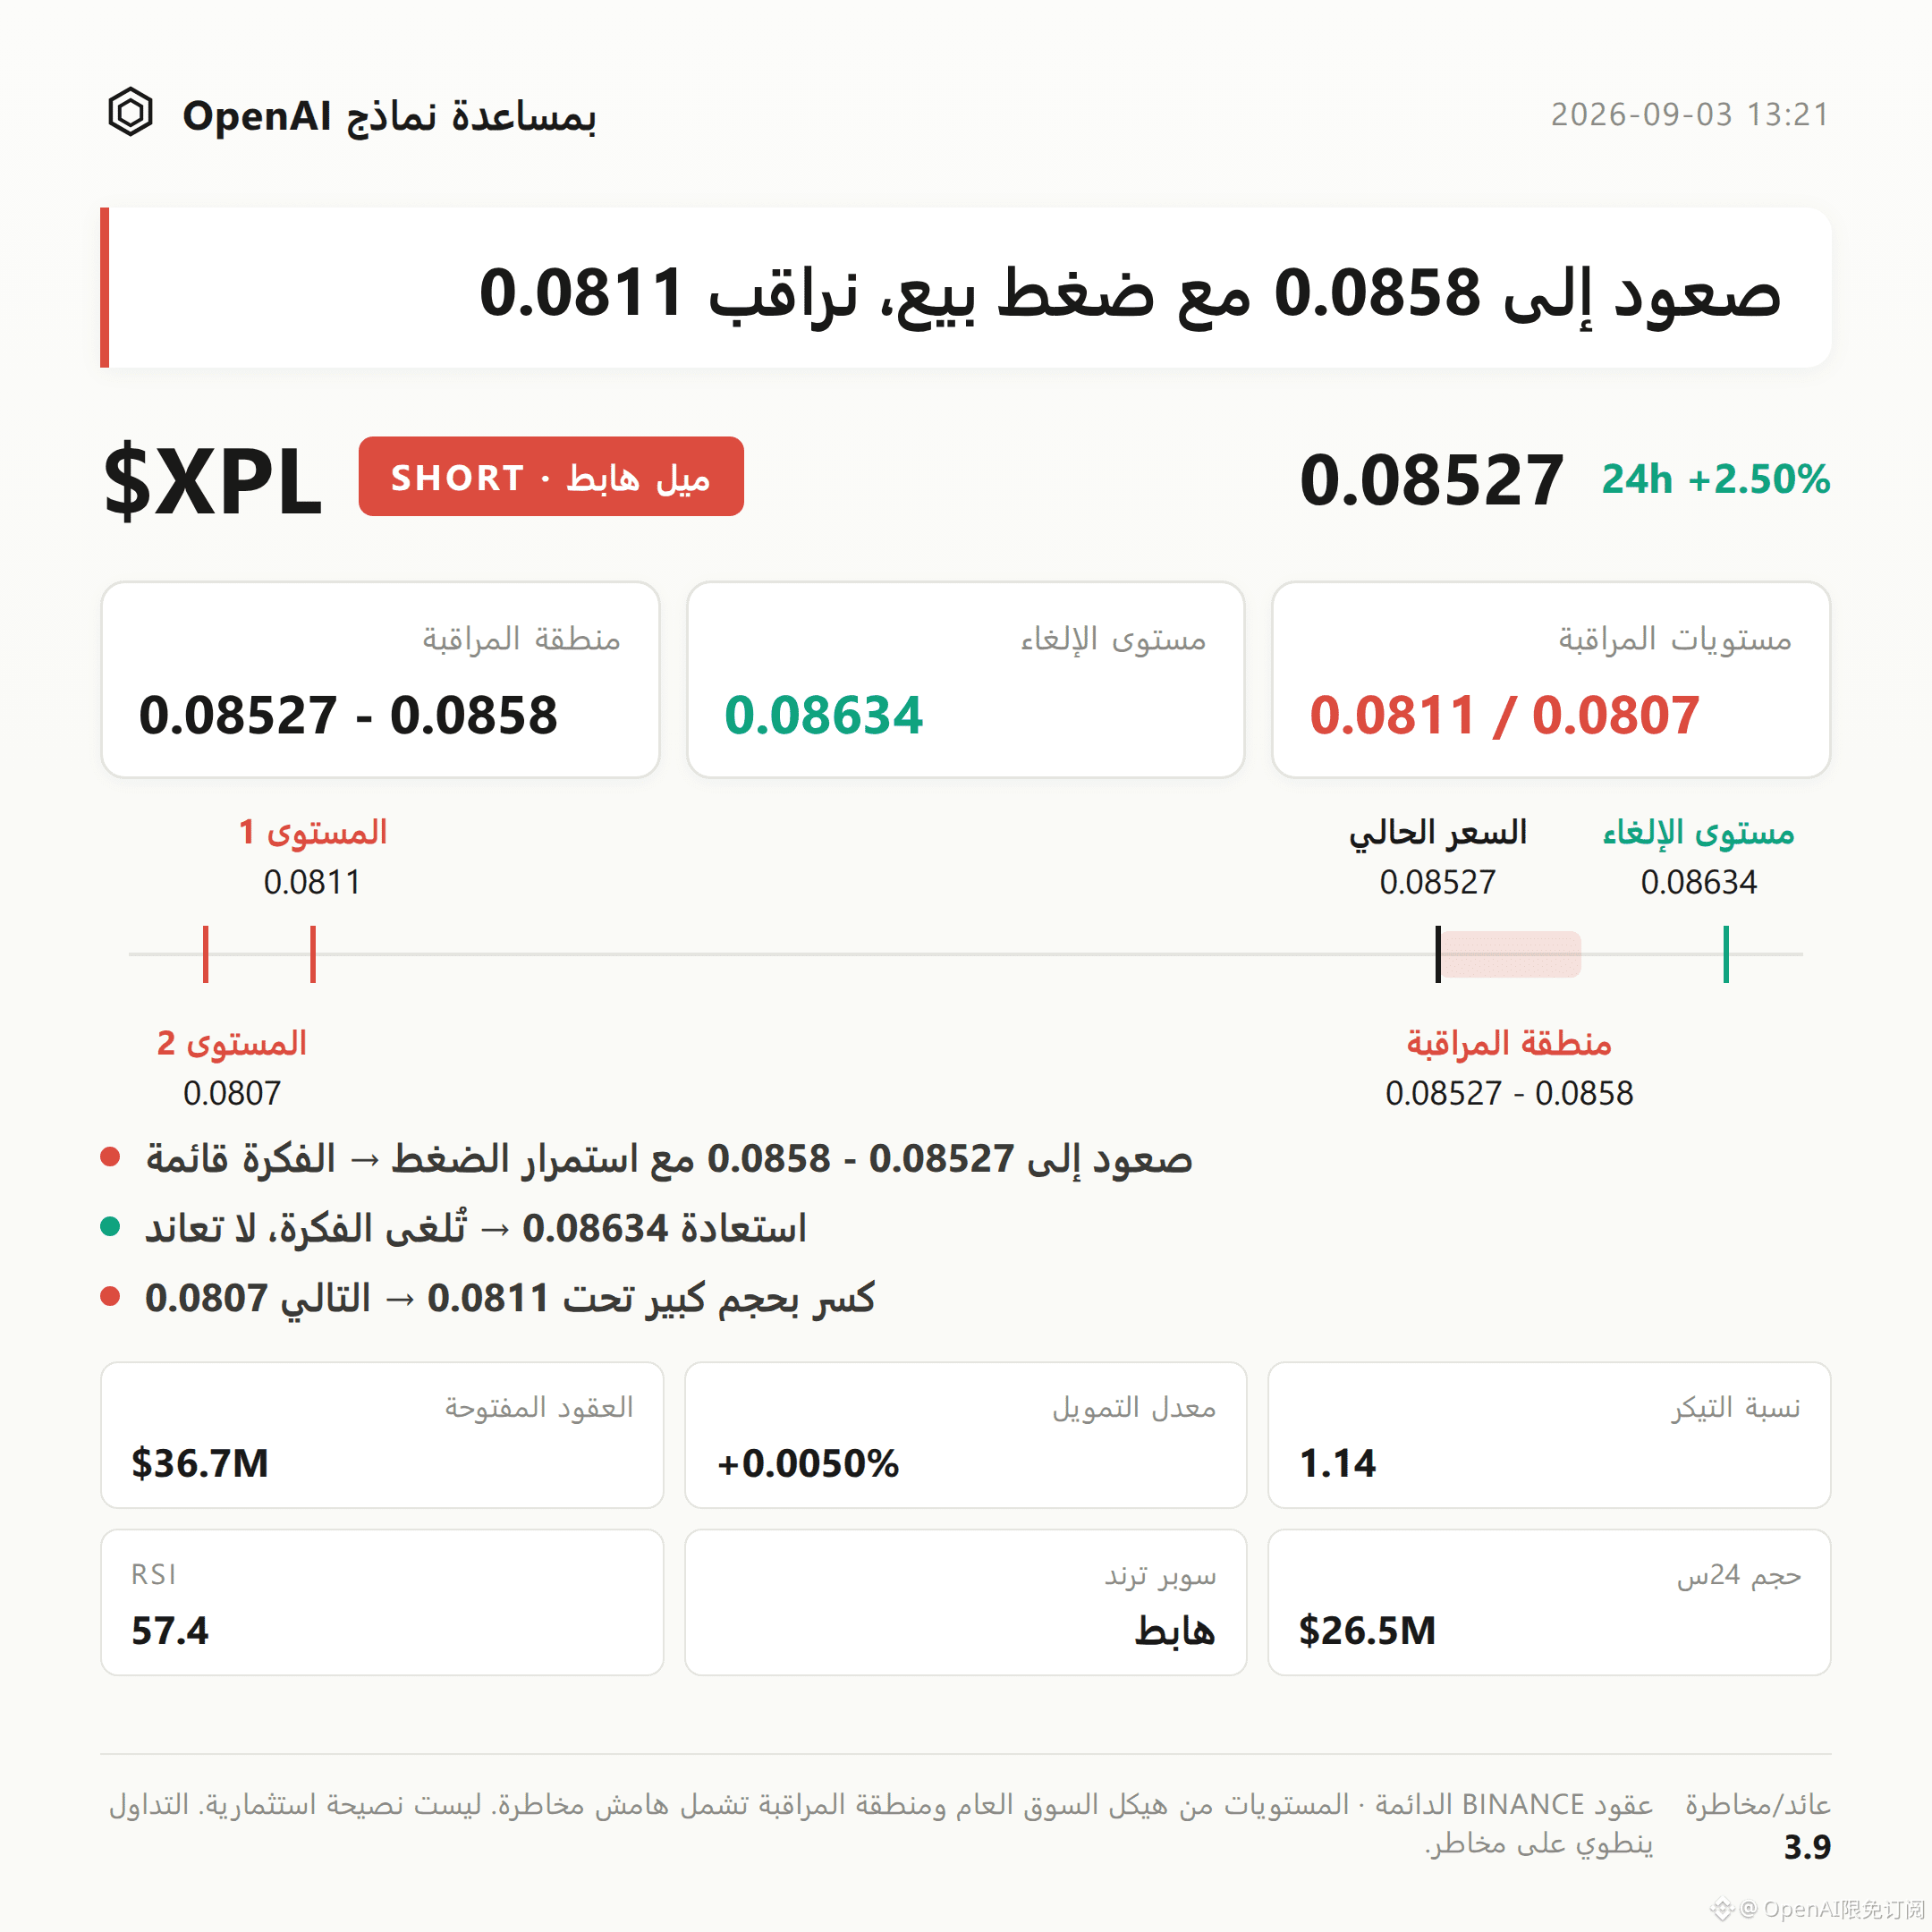
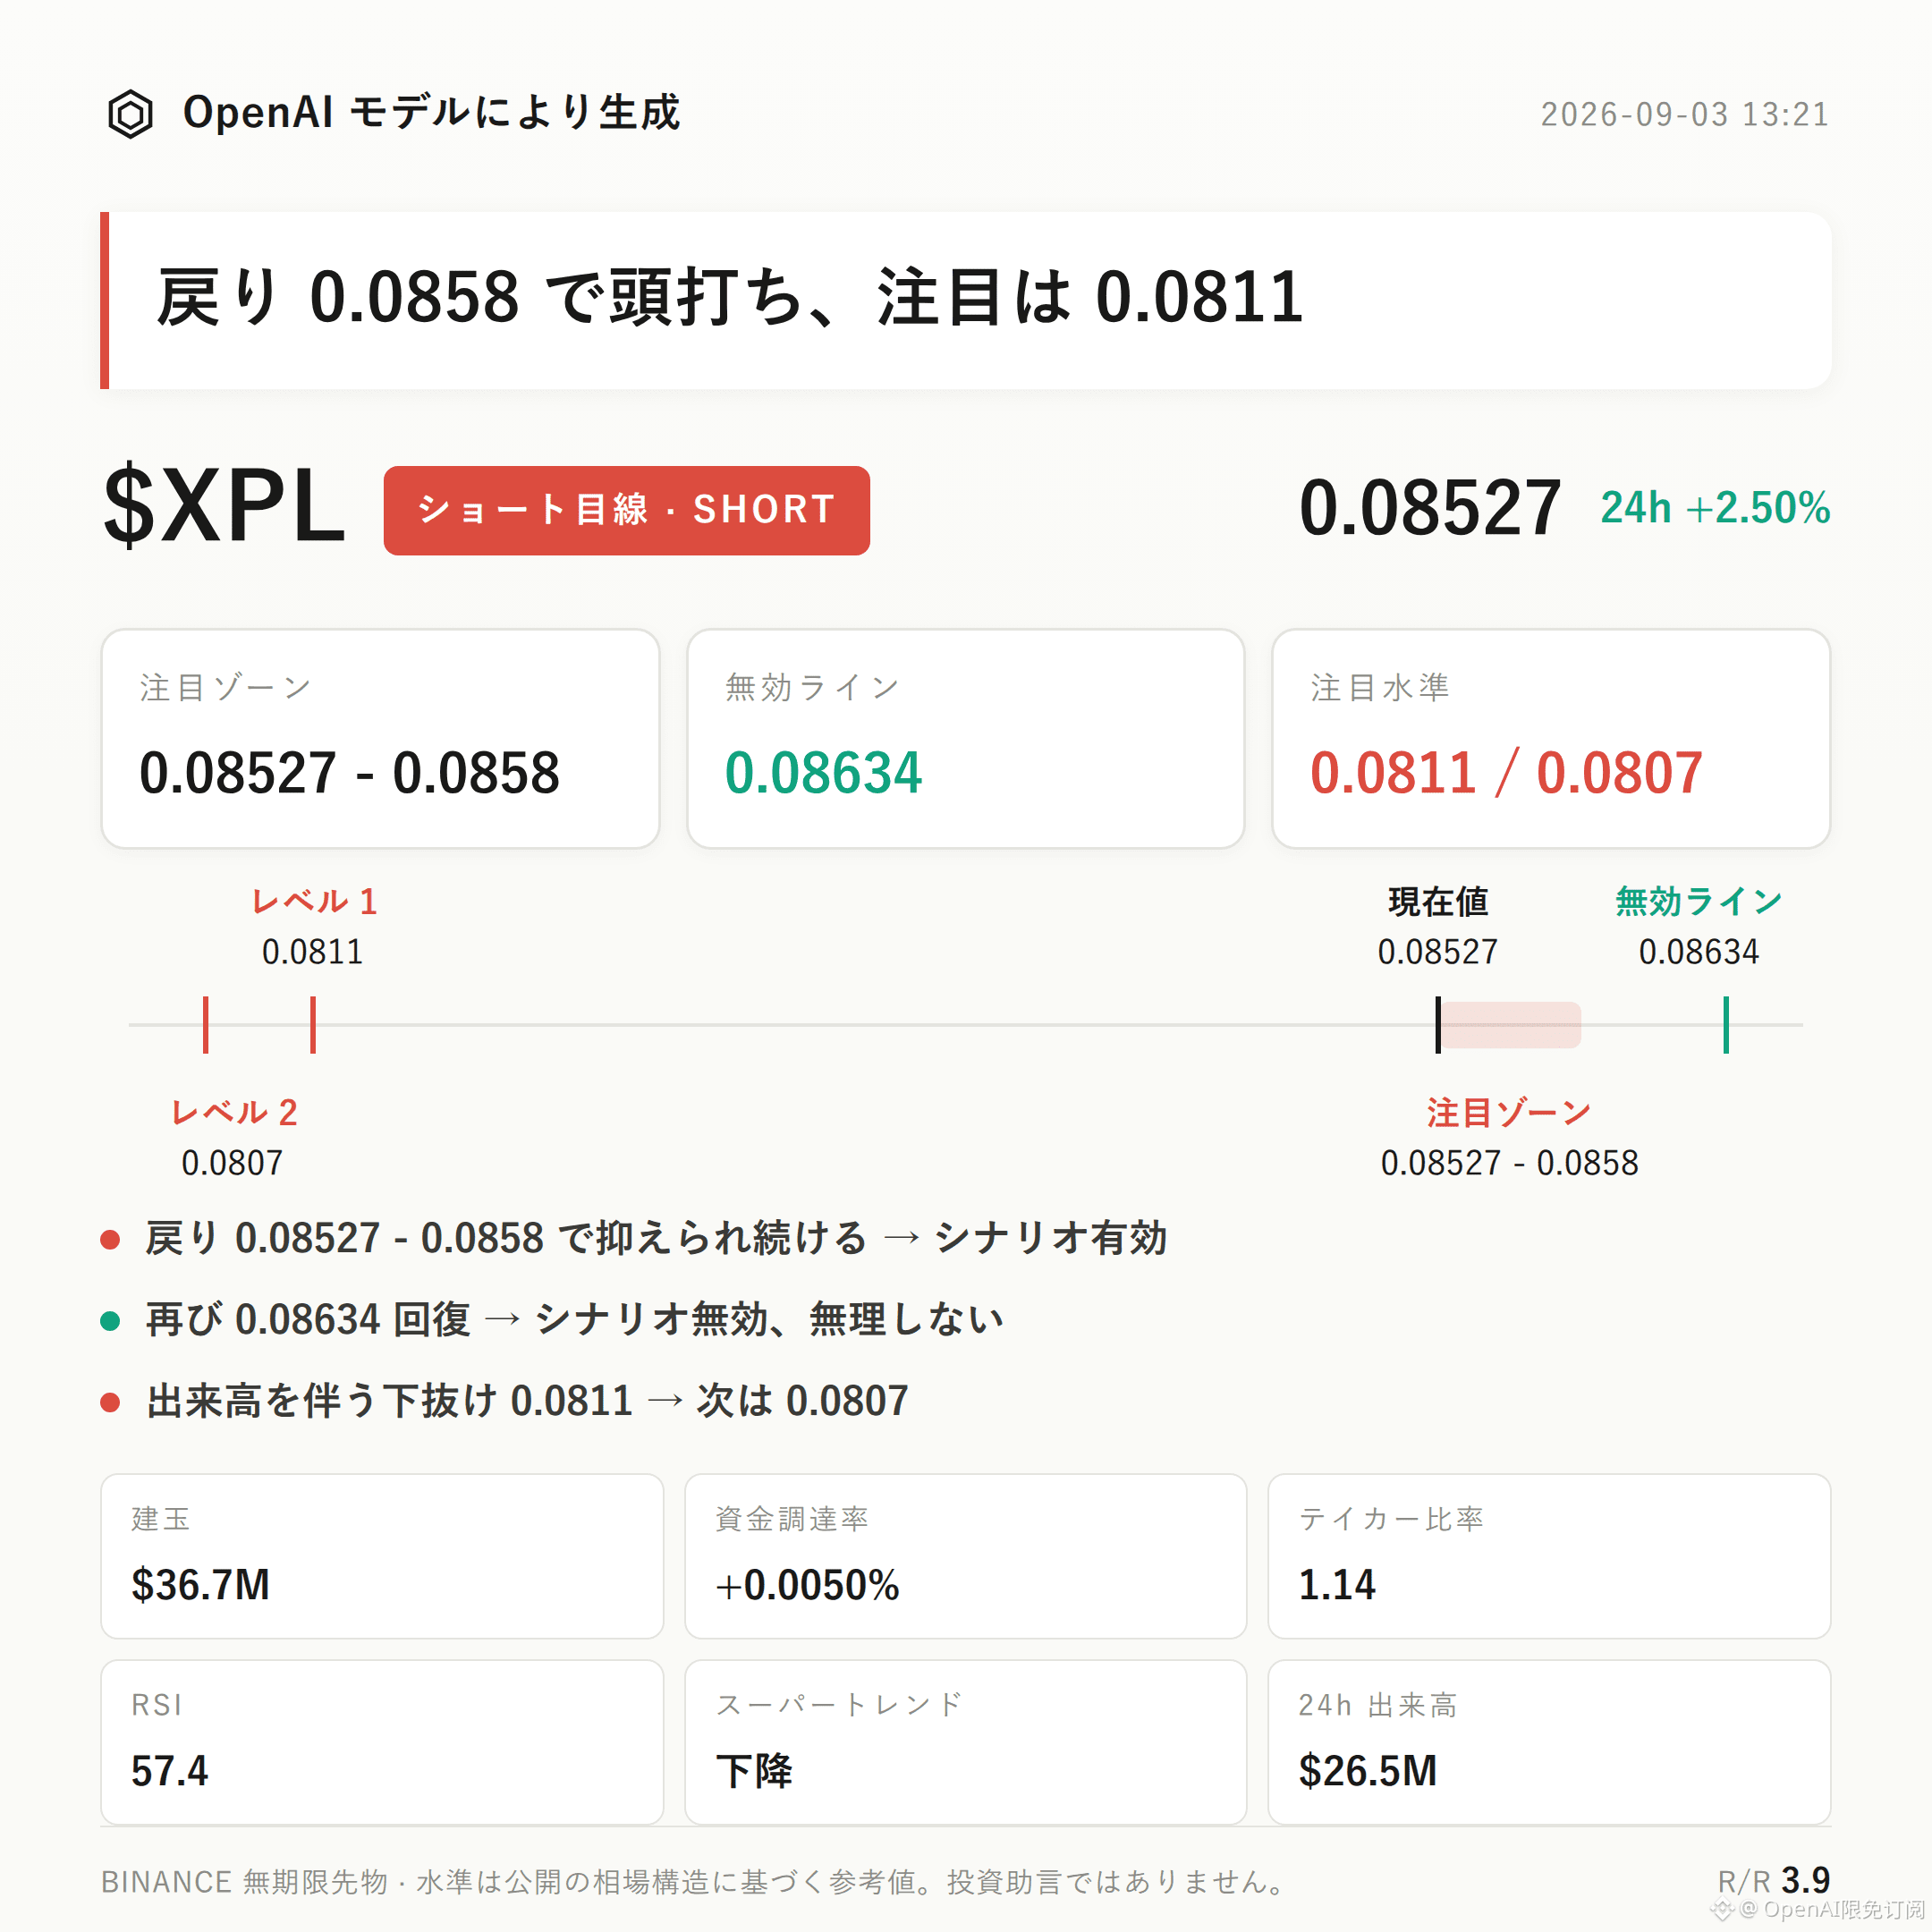
$XPL bearish-bias approach | Watch zone 0.08527 - 0.0858 | Invalidation reference 0.08634 | Observation levels 0.0811 / 0.0807
$XPL currently has a bearish-leaning structure in play.
Core argument: The Super Trend remains downward. Price is pressing near the upper Bollinger Band at 0.0858, and the recent high at 0.08634 has not yet been effectively broken. These three factors together support a pullback structure.
Confirmation method: Focus on whether any rebound can be pushed back again within the 0.08527 - 0.0858 zone, rather than assuming direction directly.
In terms of technical structure, price is currently around 0.08527, with a 24-hour price change of +2.50%. It is positioned in the upper-middle range between the recent low of 0.0807 and the recent high of 0.08634.
Bollinger Bands: upper 0.0858, middle 0.0834, lower 0.0811. The current price is running close to the upper band, leaving limited upside room.
The Super Trend direction is downward, which is the main technical basis for this bearish structure.
RSI is 57.4, sitting in a neutral-to-slightly-bullish range; it has not entered overbought territory. MACD shows bullish momentum, which diverges from the Super Trend direction—this is an opposing signal that needs to be taken seriously.
For derivatives: 24-hour trading volume is about $26.51 million, open interest about $36.69 million, and the 24-hour change is +6.7%. Price is rising while open interest increases, suggesting new capital participation, so the direction is not yet fully clear.
Funding rate is +0.0050%, relatively low, so there is not much paid pressure from longs.
The long/short accounts ratio shows longs at 44%, with shorts relatively higher. The buy/sell ratio is 1.14, meaning buyers have a slight edge. This combination of price rising while the Super Trend is down is not fully consistent, so it requires an integrated judgment based on subsequent price action.
Reference levels: If price retests 0.08527 - 0.0858 and then shows pressure there—failing to hold effectively—this bearish structure can be considered confirmed. If price reclaims 0.08634, it means the current pullback structure is broken and the bearish thesis is invalid; it should not be continued. If later a downside breakout happens with increased volume and breaks below 0.0811, you can then observe whether support near 0.0807 can absorb.
Reference risk/reward ratio: 3.9.
On the downside reversal risk side: Aside from MACD bullish momentum and the slightly long-leaning active buy/sell ratio, there are no other obvious reverse signals at present. However, contract leverage itself is a risk factor—directional judgment alone does not guarantee outcomes.
With contract leverage, position discipline matters more than direction forecasting.
Additional note from live positions: $FOGO —long positions are still held. Personally, I remain bullish on the medium-term structure.
For reference only; this does not constitute investment advice. Contracts involve leverage, and investing carries risk.
This article was generated with assistance from an OpenAI large model.
$XPL
#Contract Analysis
$XPL bearish-bias approach | Watch zone 0.08527 - 0.0858 | Invalidation reference 0.08634 | Observation levels 0.0811 / 0.0807
$XPL currently has a bearish-leaning structure in play.
Core argument: The Super Trend remains downward. Price is pressing near the upper Bollinger Band at 0.0858, and the recent high at 0.08634 has not yet been effectively broken. These three factors together support a pullback structure.
Confirmation method: Focus on whether any rebound can be pushed back again within the 0.08527 - 0.0858 zone, rather than assuming direction directly.
In terms of technical structure, price is currently around 0.08527, with a 24-hour price change of +2.50%. It is positioned in the upper-middle range between the recent low of 0.0807 and the recent high of 0.08634.
Bollinger Bands: upper 0.0858, middle 0.0834, lower 0.0811. The current price is running close to the upper band, leaving limited upside room.
The Super Trend direction is downward, which is the main technical basis for this bearish structure.
RSI is 57.4, sitting in a neutral-to-slightly-bullish range; it has not entered overbought territory. MACD shows bullish momentum, which diverges from the Super Trend direction—this is an opposing signal that needs to be taken seriously.
For derivatives: 24-hour trading volume is about $26.51 million, open interest about $36.69 million, and the 24-hour change is +6.7%. Price is rising while open interest increases, suggesting new capital participation, so the direction is not yet fully clear.
Funding rate is +0.0050%, relatively low, so there is not much paid pressure from longs.
The long/short accounts ratio shows longs at 44%, with shorts relatively higher. The buy/sell ratio is 1.14, meaning buyers have a slight edge. This combination of price rising while the Super Trend is down is not fully consistent, so it requires an integrated judgment based on subsequent price action.
Reference levels: If price retests 0.08527 - 0.0858 and then shows pressure there—failing to hold effectively—this bearish structure can be considered confirmed. If price reclaims 0.08634, it means the current pullback structure is broken and the bearish thesis is invalid; it should not be continued. If later a downside breakout happens with increased volume and breaks below 0.0811, you can then observe whether support near 0.0807 can absorb.
Reference risk/reward ratio: 3.9.
On the downside reversal risk side: Aside from MACD bullish momentum and the slightly long-leaning active buy/sell ratio, there are no other obvious reverse signals at present. However, contract leverage itself is a risk factor—directional judgment alone does not guarantee outcomes.
With contract leverage, position discipline matters more than direction forecasting.
Additional note from live positions: $FOGO —long positions are still held. Personally, I remain bullish on the medium-term structure.
For reference only; this does not constitute investment advice. Contracts involve leverage, and investing carries risk.
This article was generated with assistance from an OpenAI large model.
$XPL
#Contract Analysis