
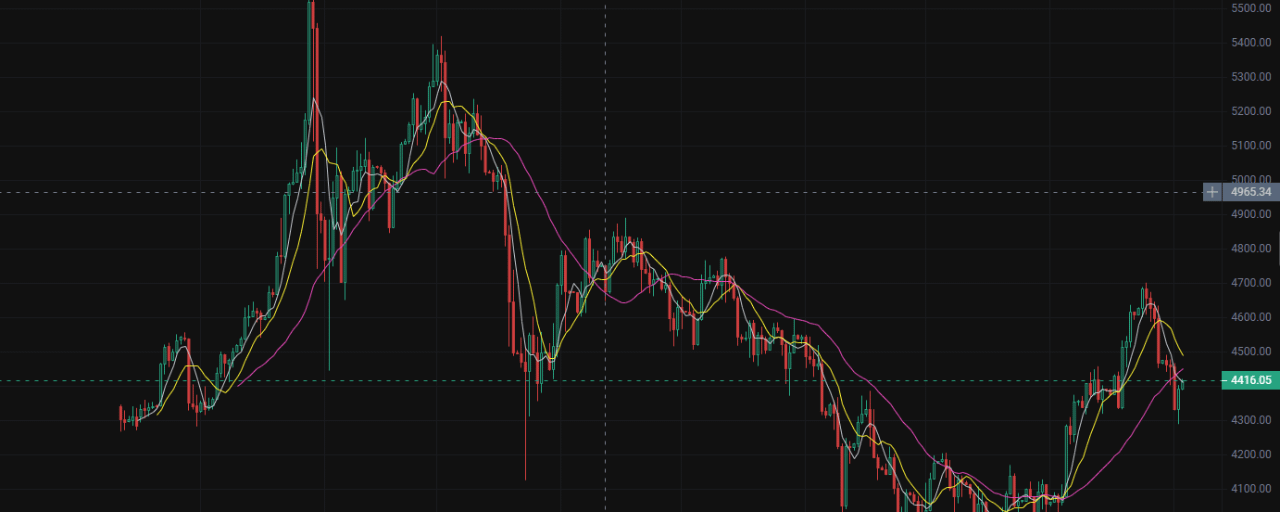

Release Date: September 3, 2026
Underlying Asset: XAU/USDT (Gold Token/XAU)
Live Reference Price: $4415.08
1. Daily Timeframe Analysis: The pullback has completed and key support has been met; the ascending channel remains intact
Based on the candlestick structure, after XAU went through a range-bound shakeout at the earlier high level, the daily timeframe is now showing very strong signs of a bottoming out and stabilization.
Moving Average System (EMA): After the daily K-line precisely touches the 20-day Exponential Moving Average (EMA20) and the support zone of the 50-day moving average, it rapidly forms a Hammer candlestick with a long lower shadow. This indicates that the buy-side defense below is extremely firm, and the uptrend has not been fundamentally damaged.
Bollinger Bands (Bollinger Bands): Price stabilizes above the Bollinger middle band. The upper and lower bands are converging, suggesting that a period of intense directional breakout is about to arrive.
Volume and MACD: During the pullback, volume contracts, which is a standard “fake dump and shakeout.” A bearish dead cross above the MACD zero axis has already produced clearly reduced green bars. The two lines are flattening, ready at any moment for a second surge into a golden cross above the zero axis.
Daily wrap-up: Overall, the upward channel remains solid, and the $4400–$4410 area has established a very strong base of main fund positioning.
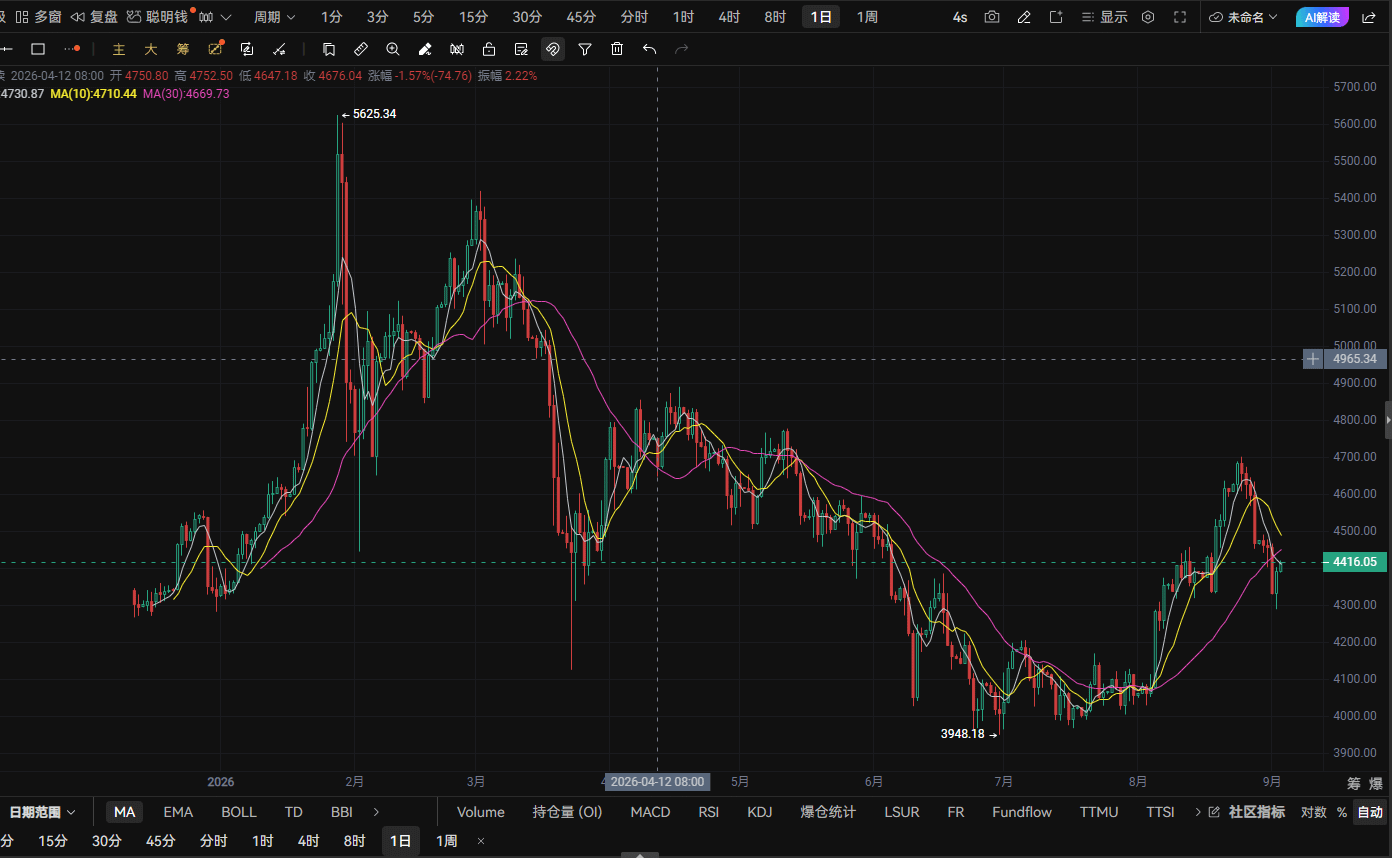
II. Analysis of the 4-hour timeframe (4H): The bottom divergence structure is established, and the right leg of the W bottom is perfectly lifted.
Switch to the 4H view. The K-line pattern and technical indicators generate very standard bullish confluence signals:
Pattern (Morphology): The K-line is constructing an extremely standard double bottom (W bottom) formation. The high point at the bottom of the right leg is clearly higher than the left leg’s, forming a typical “Higher Low” structure.
Indicator bottom divergence (MACD Divergence): On the 4H timeframe, the MACD histogram achieves a bottom divergence with expanding volume. The DIF line crosses above the DEA line, forming a strong golden cross below the zero axis—this is a very high-probability right-side entry signal.
RSI momentum correction: The 14-period RSI rapidly rebounds from the oversold edge around 38 and breaks above the 50 strength boundary, and the long-side main momentum fully recovers.
4H wrap-up: The 4H structure completes its second confirmation. Any short-term pullback is a “money-sending” opportunity. The right-side breakout at the critical point is about to trigger.
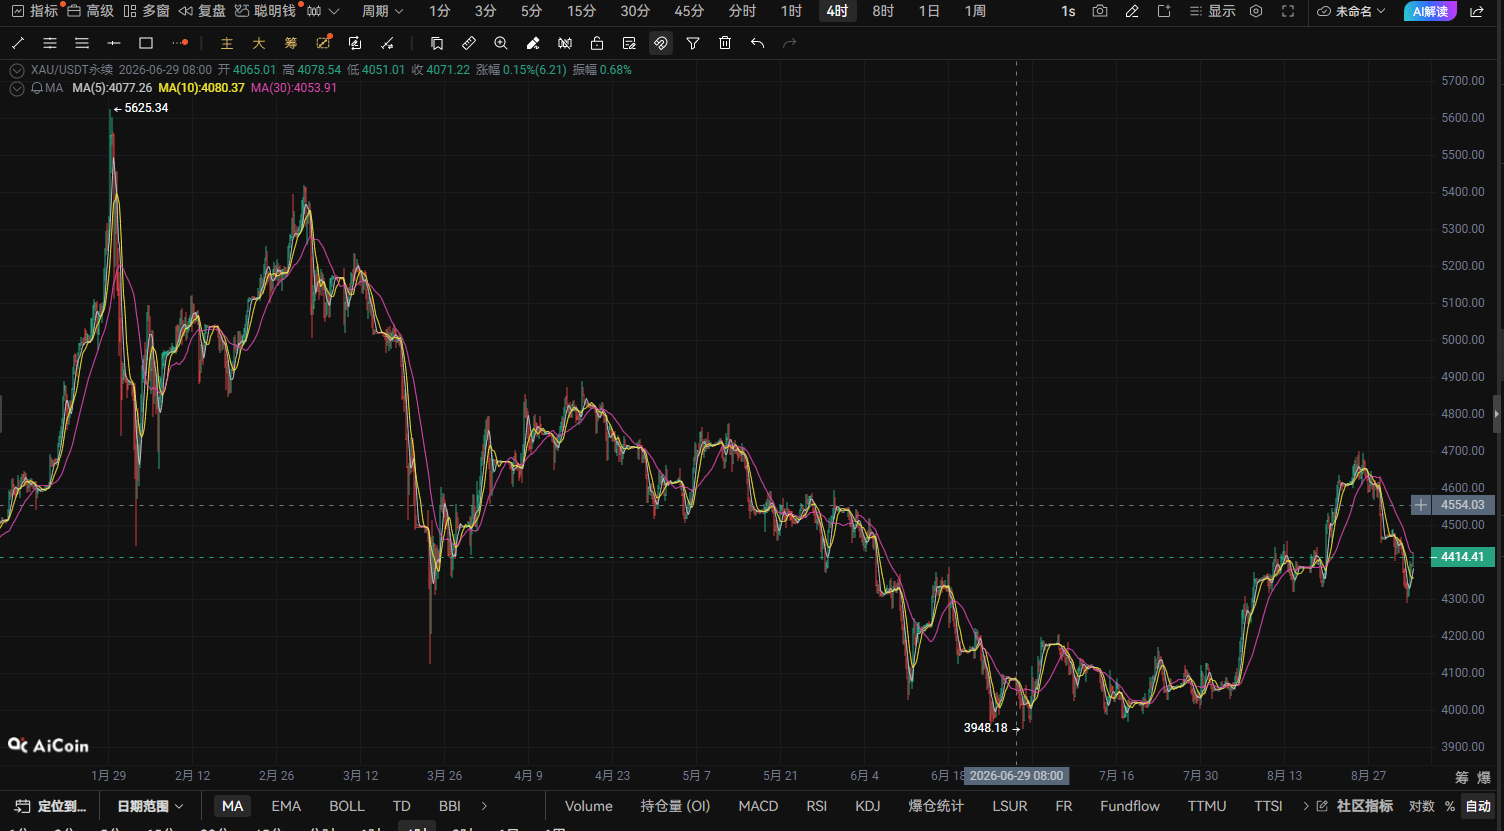
III. Analysis of the 1-hour timeframe (1H): Breaks the micro downtrend line and forms a “breakout–pullback” confirmation
From a micro perspective, the 1H K-line price action provides us with an accurate entry timing:
Downtrend line breakout: The 1H K-line has successfully broken through the resistance of the recent local downtrend line with volume, and it closes with a full-bodied bullish candle.
K-line combination language: Around $4415.08, bullish piercing (Bullish Piercing) and a morning star (Morning Star) combination appear consecutively. Microscopically, the bearish momentum has nearly exhausted.
Short-term moving average alignment: MA5, MA10, and MA20 form a bullish stack, providing a dense support layer very close below.
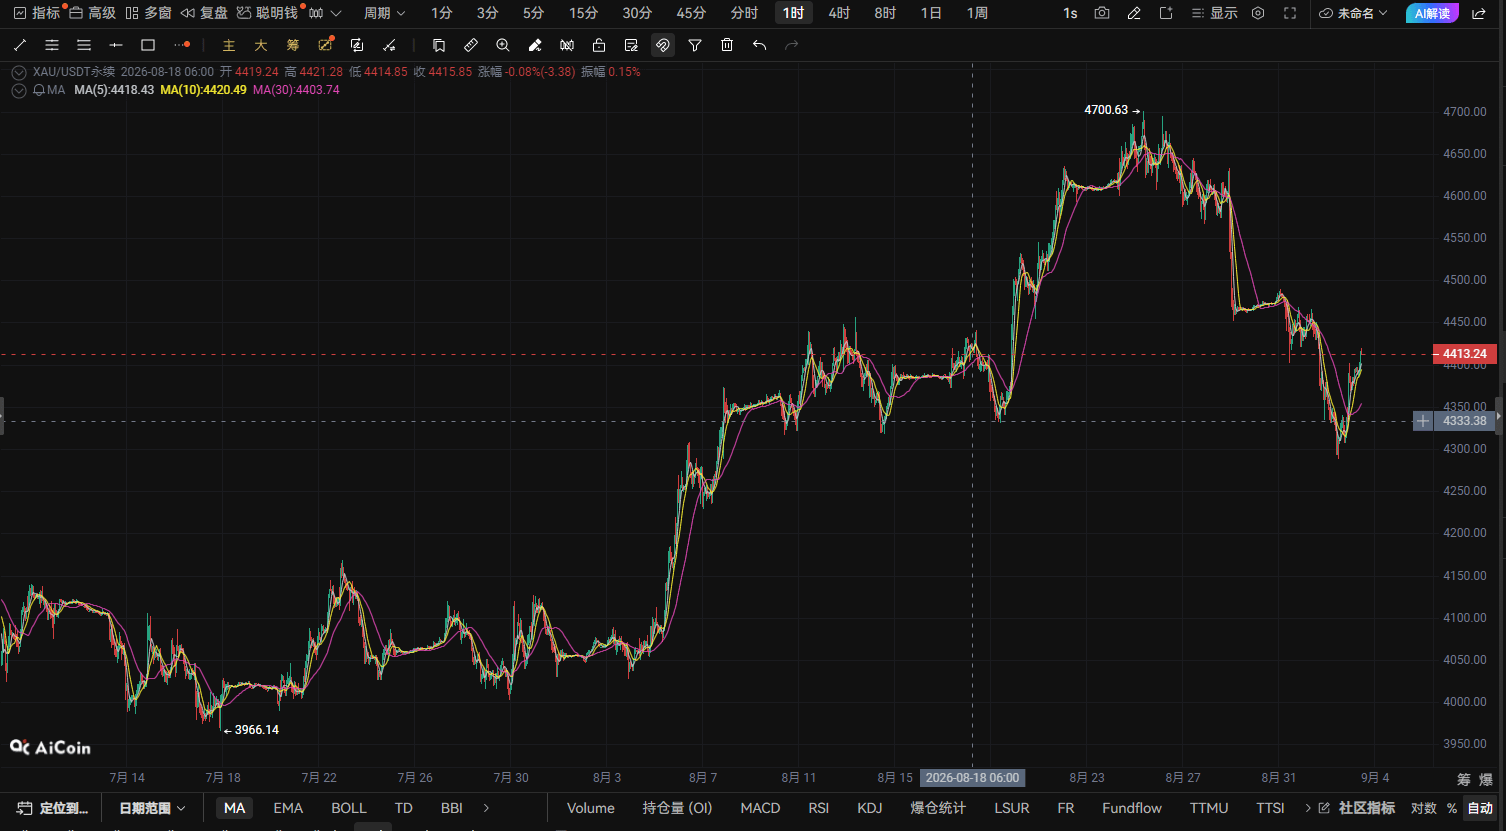
IV. Comprehensive assessment and trading suggestions
At $4415.08, XAU gathers three major bullish catalysts at once: daily moving-average support, the 4H bottom-divergence W bottom, and the 1H trendline breakout. The risk/reward ratio on the order book is excellent—there’s no need to wait. Open a long position directly at the current price!
V. Real-time strategy order (open directly at current price)
Trading instrument: $XAU /USDT (perpetual/contract)
Trade direction: Long (LONG)
Entry price: 4415.08
Stop-loss price: 4348.85
First take-profit level: 4459.23
Second take-profit level: 4503.38#伊朗导弹无人机袭击科威特基地