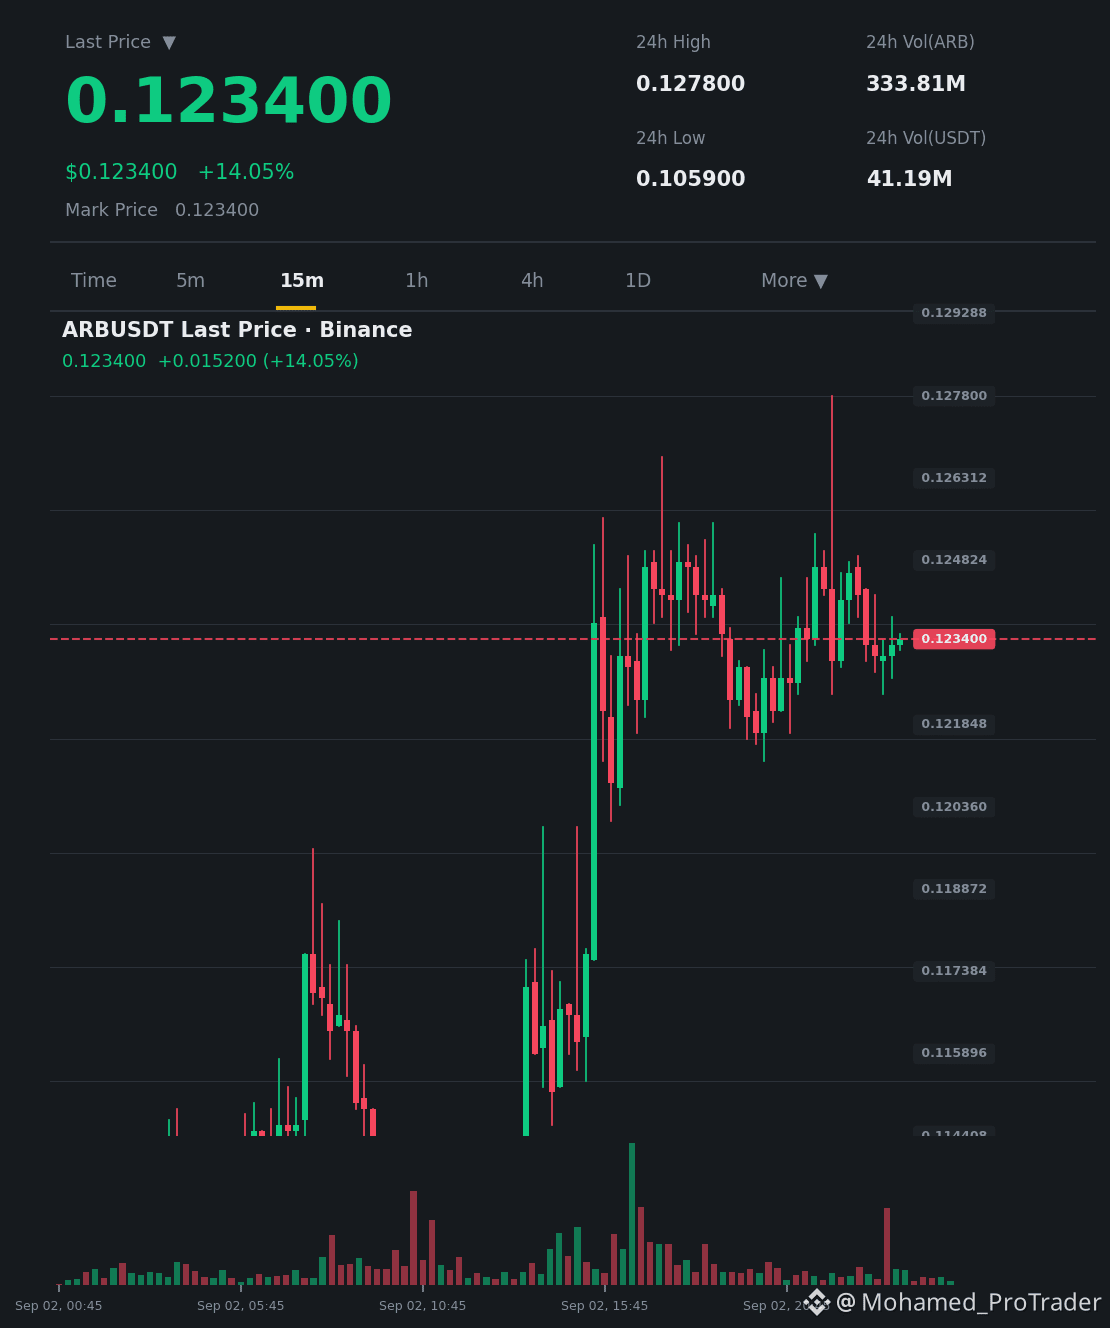
$ARB Jumps 11.78% in 24 hours... but does the trading volume support this breakout?
Overview & Data:
Current price is 0.1234 with a strong move on the 15-minute chart; however, the volume ratio (vol_ratio) is only 0.03, indicating extremely weak liquidity compared to the average. The move lacks institutional confirmation, and the RSI is approaching overbought zones, which increases the risk of a rapid pullback.
Scenarios:
Positive: If volume breaks above the average during the next session, it supports the continuation of momentum toward higher resistance levels.
Negative: If volume remains subdued, the price may undergo a sharp technical correction toward the 0.1150 area to fill the liquidity gap.
Conclusion:
The key factor is the return of volume above average to confirm the validity of the breakout.
Do you think the current rise is just a liquidity trap or the start of a new trend?
$ARB
This content is not investment advice—do your own research (DYOR)
Overview & Data:
Current price is 0.1234 with a strong move on the 15-minute chart; however, the volume ratio (vol_ratio) is only 0.03, indicating extremely weak liquidity compared to the average. The move lacks institutional confirmation, and the RSI is approaching overbought zones, which increases the risk of a rapid pullback.
Scenarios:
Positive: If volume breaks above the average during the next session, it supports the continuation of momentum toward higher resistance levels.
Negative: If volume remains subdued, the price may undergo a sharp technical correction toward the 0.1150 area to fill the liquidity gap.
Conclusion:
The key factor is the return of volume above average to confirm the validity of the breakout.
Do you think the current rise is just a liquidity trap or the start of a new trend?
$ARB
This content is not investment advice—do your own research (DYOR)