BTC/USDT ANALYSIS REPORT - US SESSION SUMMARY & EUR-ASIA DIRECTION
1. SUMMARY OF THE JUST-CONCLUDED US SESSION
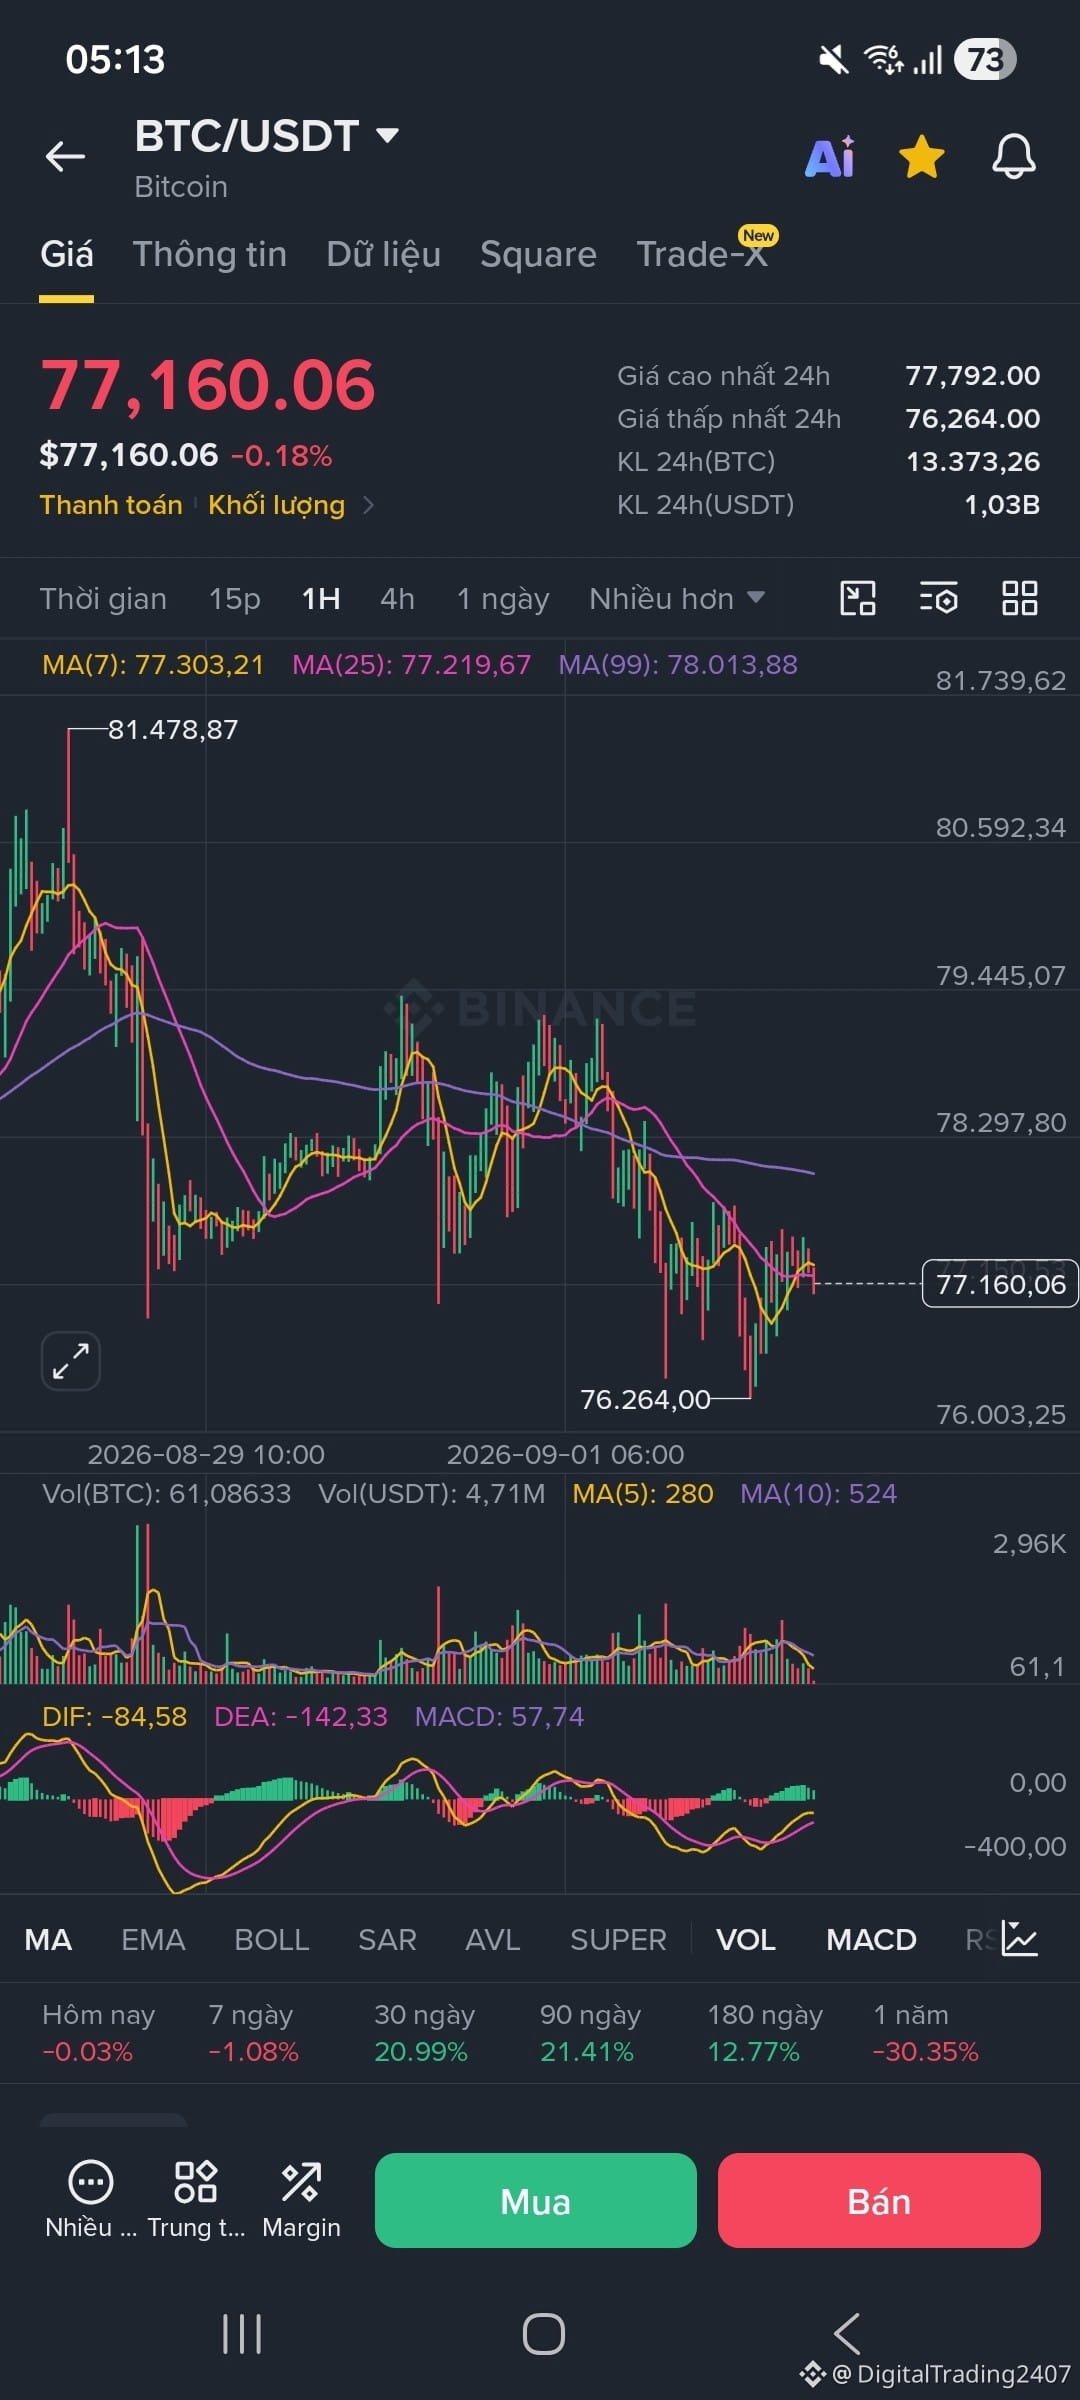
• Price action: Strong net selling pressure pushed BTC down sharply from the short-term peak >$78,000 to the 24h low at $76,264.00, before a slight rebound toward $77,160.06.
• Macroeconomic backdrop: The market triggered a risk-off sentiment due to geopolitical tensions flaring in the Middle East, causing Brent crude oil to surge. Rising US Treasury yields, along with expectations that the Fed will keep rates unchanged, led to capital retreating from the Crypto market.
2. TECHNICAL ANALYSIS: 1-HOUR CHART (1H)
• Trend: The short-term bearish structure is dominant, with price completely below MA(7): 77,303 and MA(25): 77,219.
• MACD indicator: The DIF/DEA lines are well below the 0 line, indicating strong selling pressure. However, the Histogram is gradually narrowing and turning toward green, suggesting selling momentum is weakening and a technical rebound (Technical Bounce) may appear.
• Volume: Selling volume spiked sharply on the declining candles near the bottom, showing that buy-the-dip demand is participating and absorbing part of the selling flow.
3. KEY PRICE MILESTONES TO NOTE
• Near-term resistance: $77,300 - $77,500 (MA7 and MA25 convergence)
• Major resistance: $78,300
• Near-term support: $76,200 - $76,400 (previous bottom zone)
• Psychological support: $75,000
4. TRADING STRATEGY DIRECTION FOR THE EUR-ASIA SESSION
The EUR-Asia session market often trades sideways (Sideway) or makes a mild rebound after a night of strong volatility.
• Preferred Short scenario: Wait for a technical pullback to test the resistance zone $77,300 - $77,500. If a rejection candle (long wick rejection) appears, open a SHORT position targeting $76,500. Set an absolute stop-loss (SL) above $77,800.
$BTC
1. SUMMARY OF THE JUST-CONCLUDED US SESSION
• Price action: Strong net selling pressure pushed BTC down sharply from the short-term peak >$78,000 to the 24h low at $76,264.00, before a slight rebound toward $77,160.06.
• Macroeconomic backdrop: The market triggered a risk-off sentiment due to geopolitical tensions flaring in the Middle East, causing Brent crude oil to surge. Rising US Treasury yields, along with expectations that the Fed will keep rates unchanged, led to capital retreating from the Crypto market.
2. TECHNICAL ANALYSIS: 1-HOUR CHART (1H)
• Trend: The short-term bearish structure is dominant, with price completely below MA(7): 77,303 and MA(25): 77,219.
• MACD indicator: The DIF/DEA lines are well below the 0 line, indicating strong selling pressure. However, the Histogram is gradually narrowing and turning toward green, suggesting selling momentum is weakening and a technical rebound (Technical Bounce) may appear.
• Volume: Selling volume spiked sharply on the declining candles near the bottom, showing that buy-the-dip demand is participating and absorbing part of the selling flow.
3. KEY PRICE MILESTONES TO NOTE
• Near-term resistance: $77,300 - $77,500 (MA7 and MA25 convergence)
• Major resistance: $78,300
• Near-term support: $76,200 - $76,400 (previous bottom zone)
• Psychological support: $75,000
4. TRADING STRATEGY DIRECTION FOR THE EUR-ASIA SESSION
The EUR-Asia session market often trades sideways (Sideway) or makes a mild rebound after a night of strong volatility.
• Preferred Short scenario: Wait for a technical pullback to test the resistance zone $77,300 - $77,500. If a rejection candle (long wick rejection) appears, open a SHORT position targeting $76,500. Set an absolute stop-loss (SL) above $77,800.
$BTC