Trading Thesis|9/3 04:21
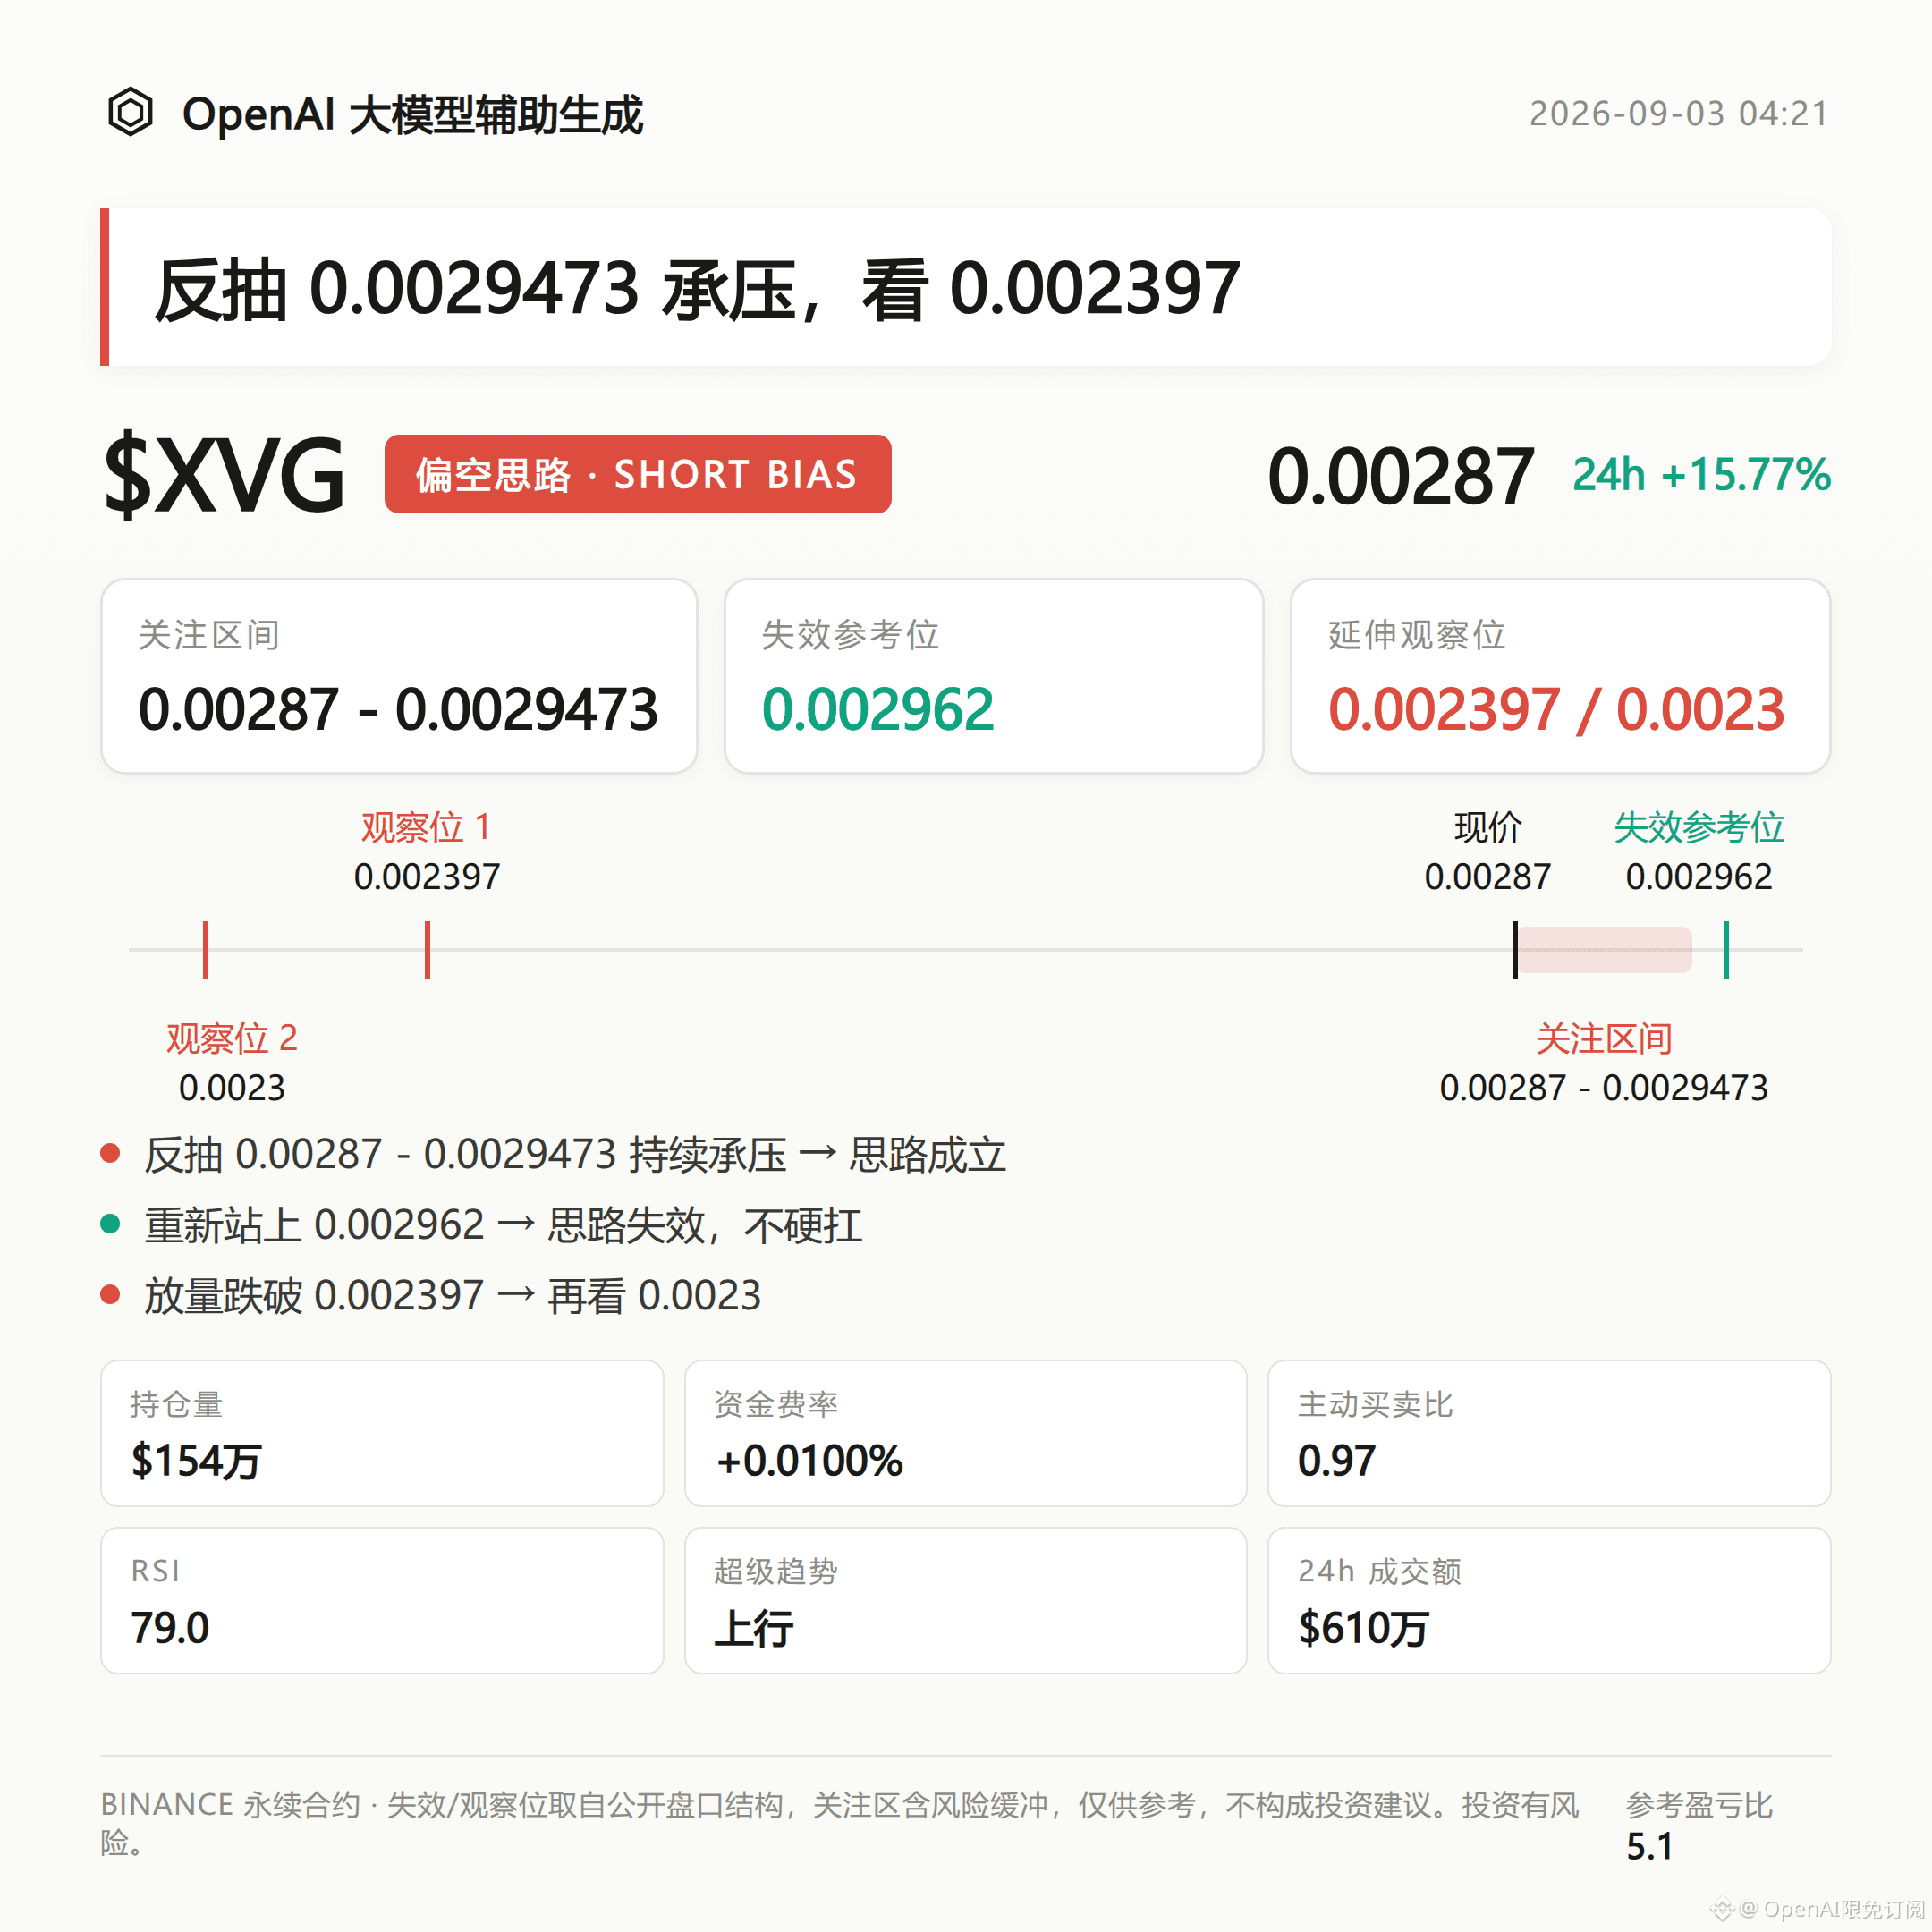
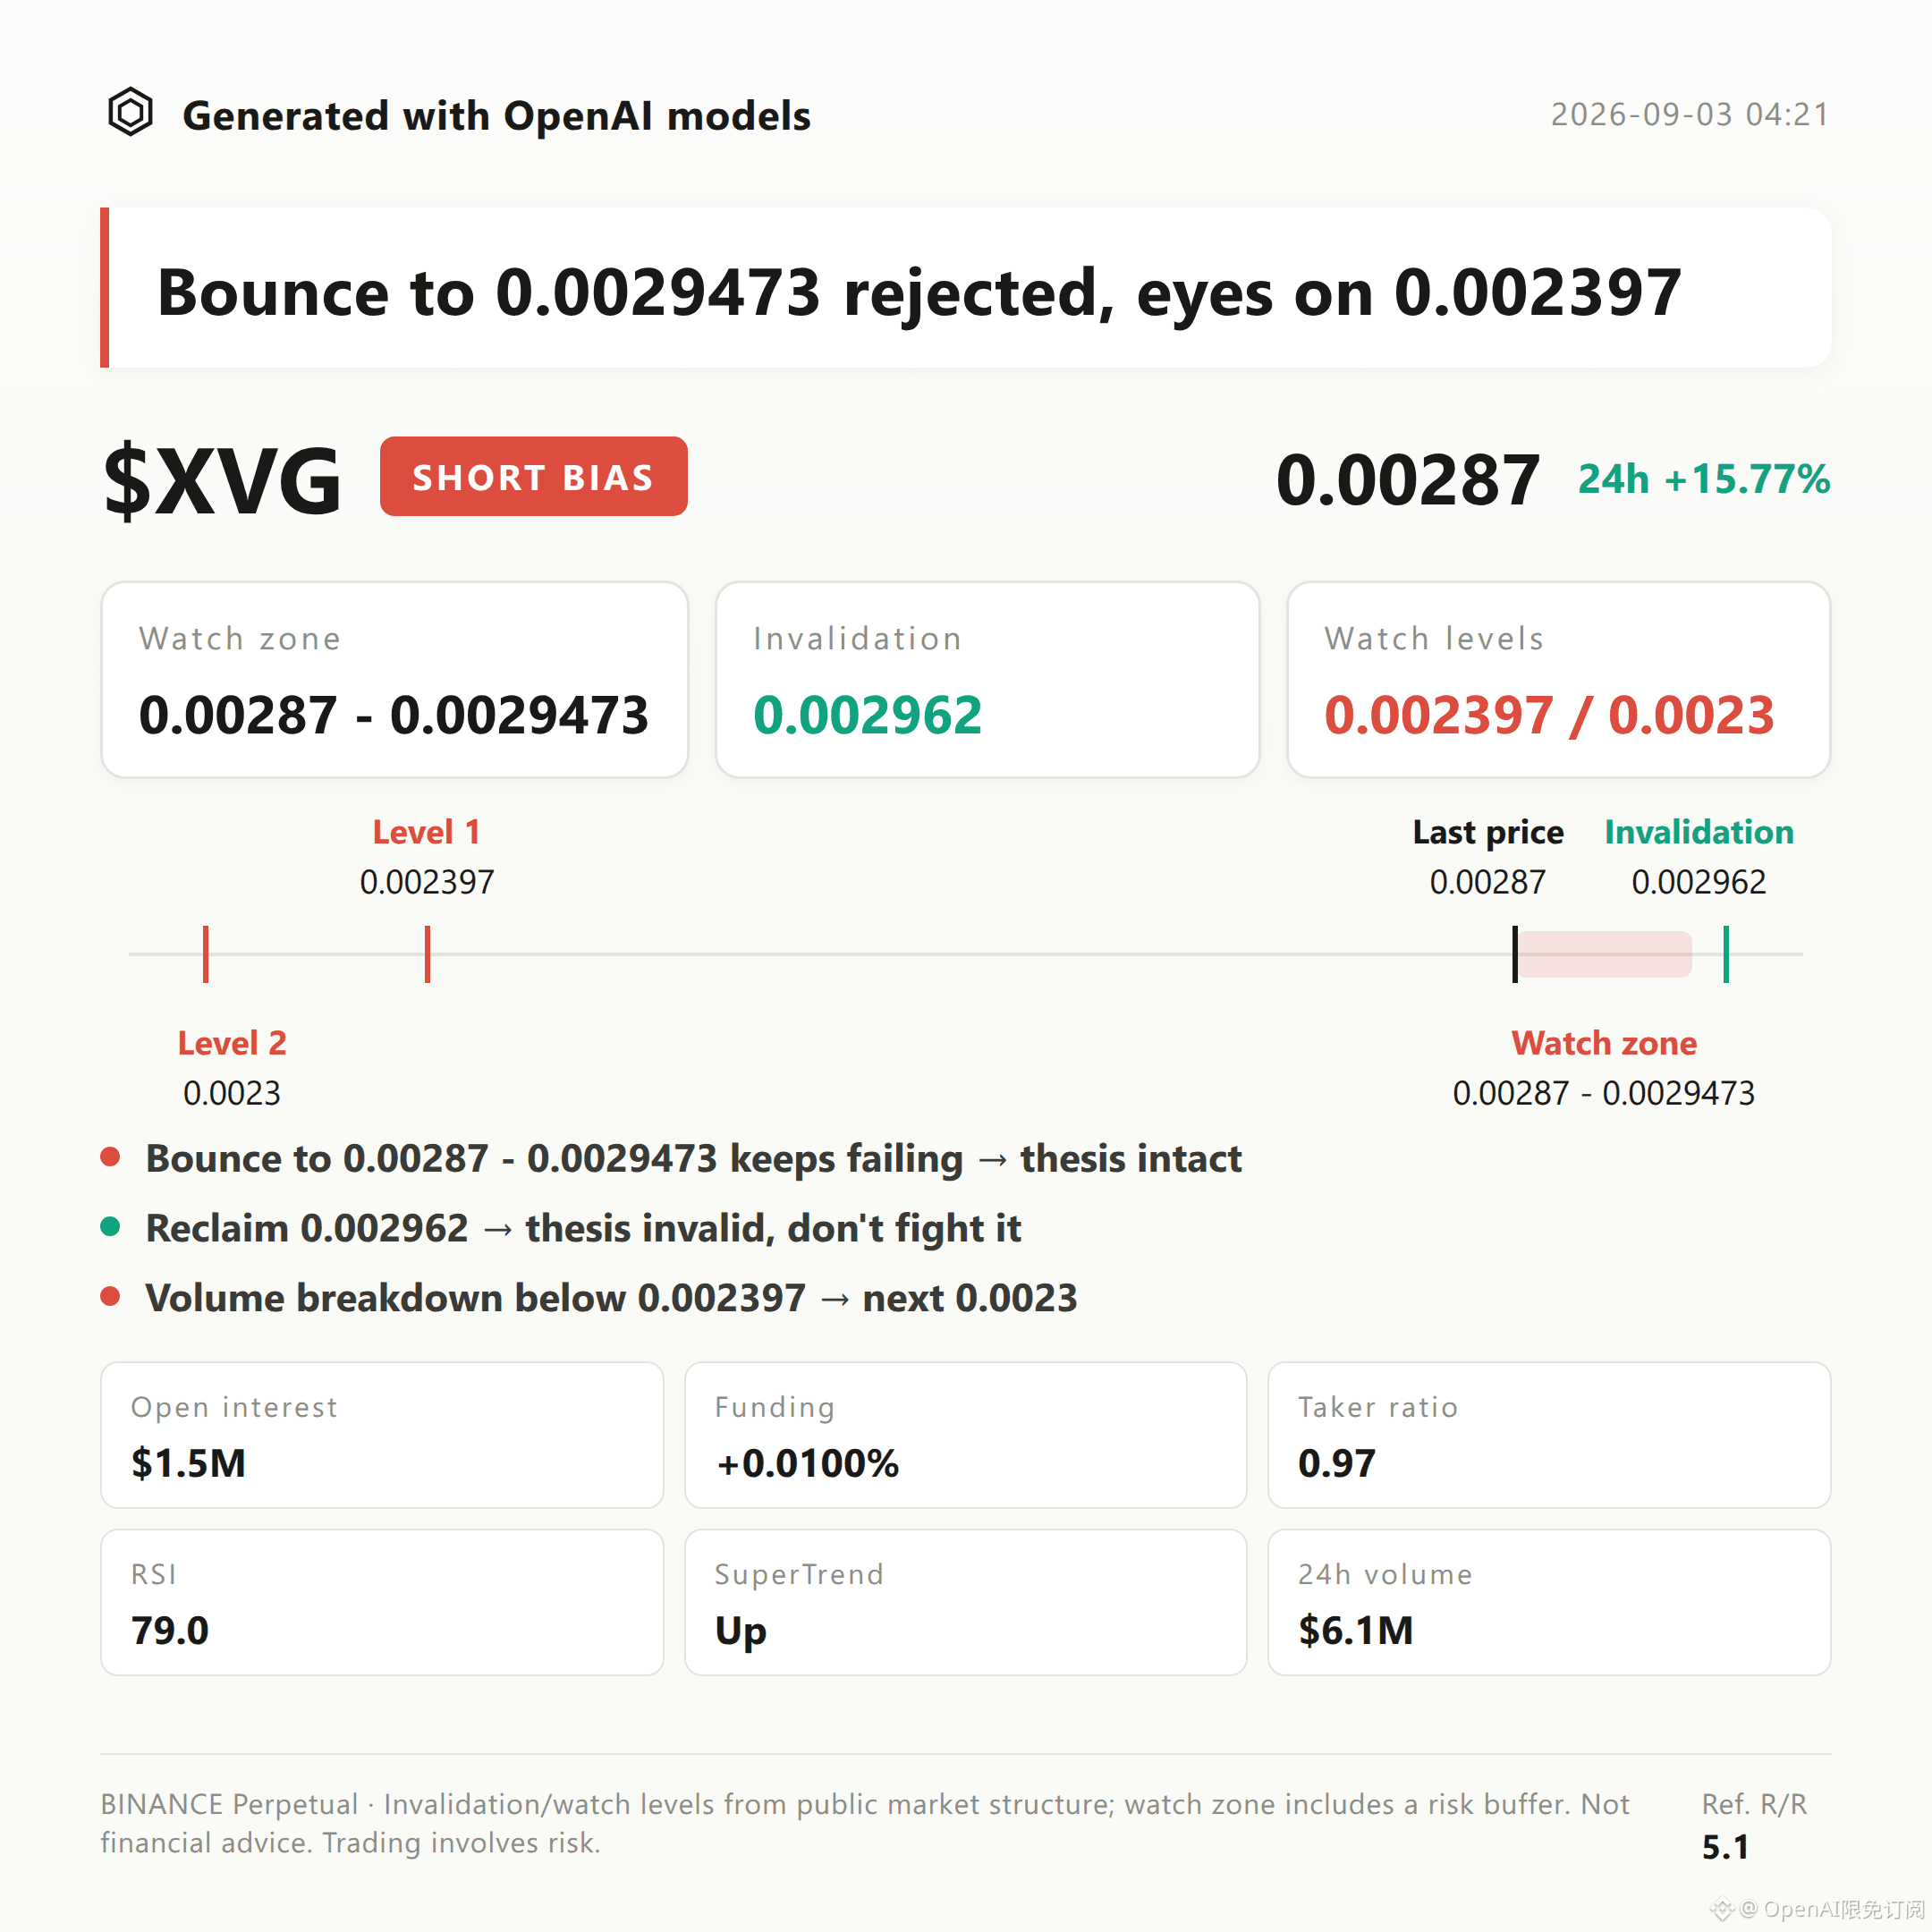
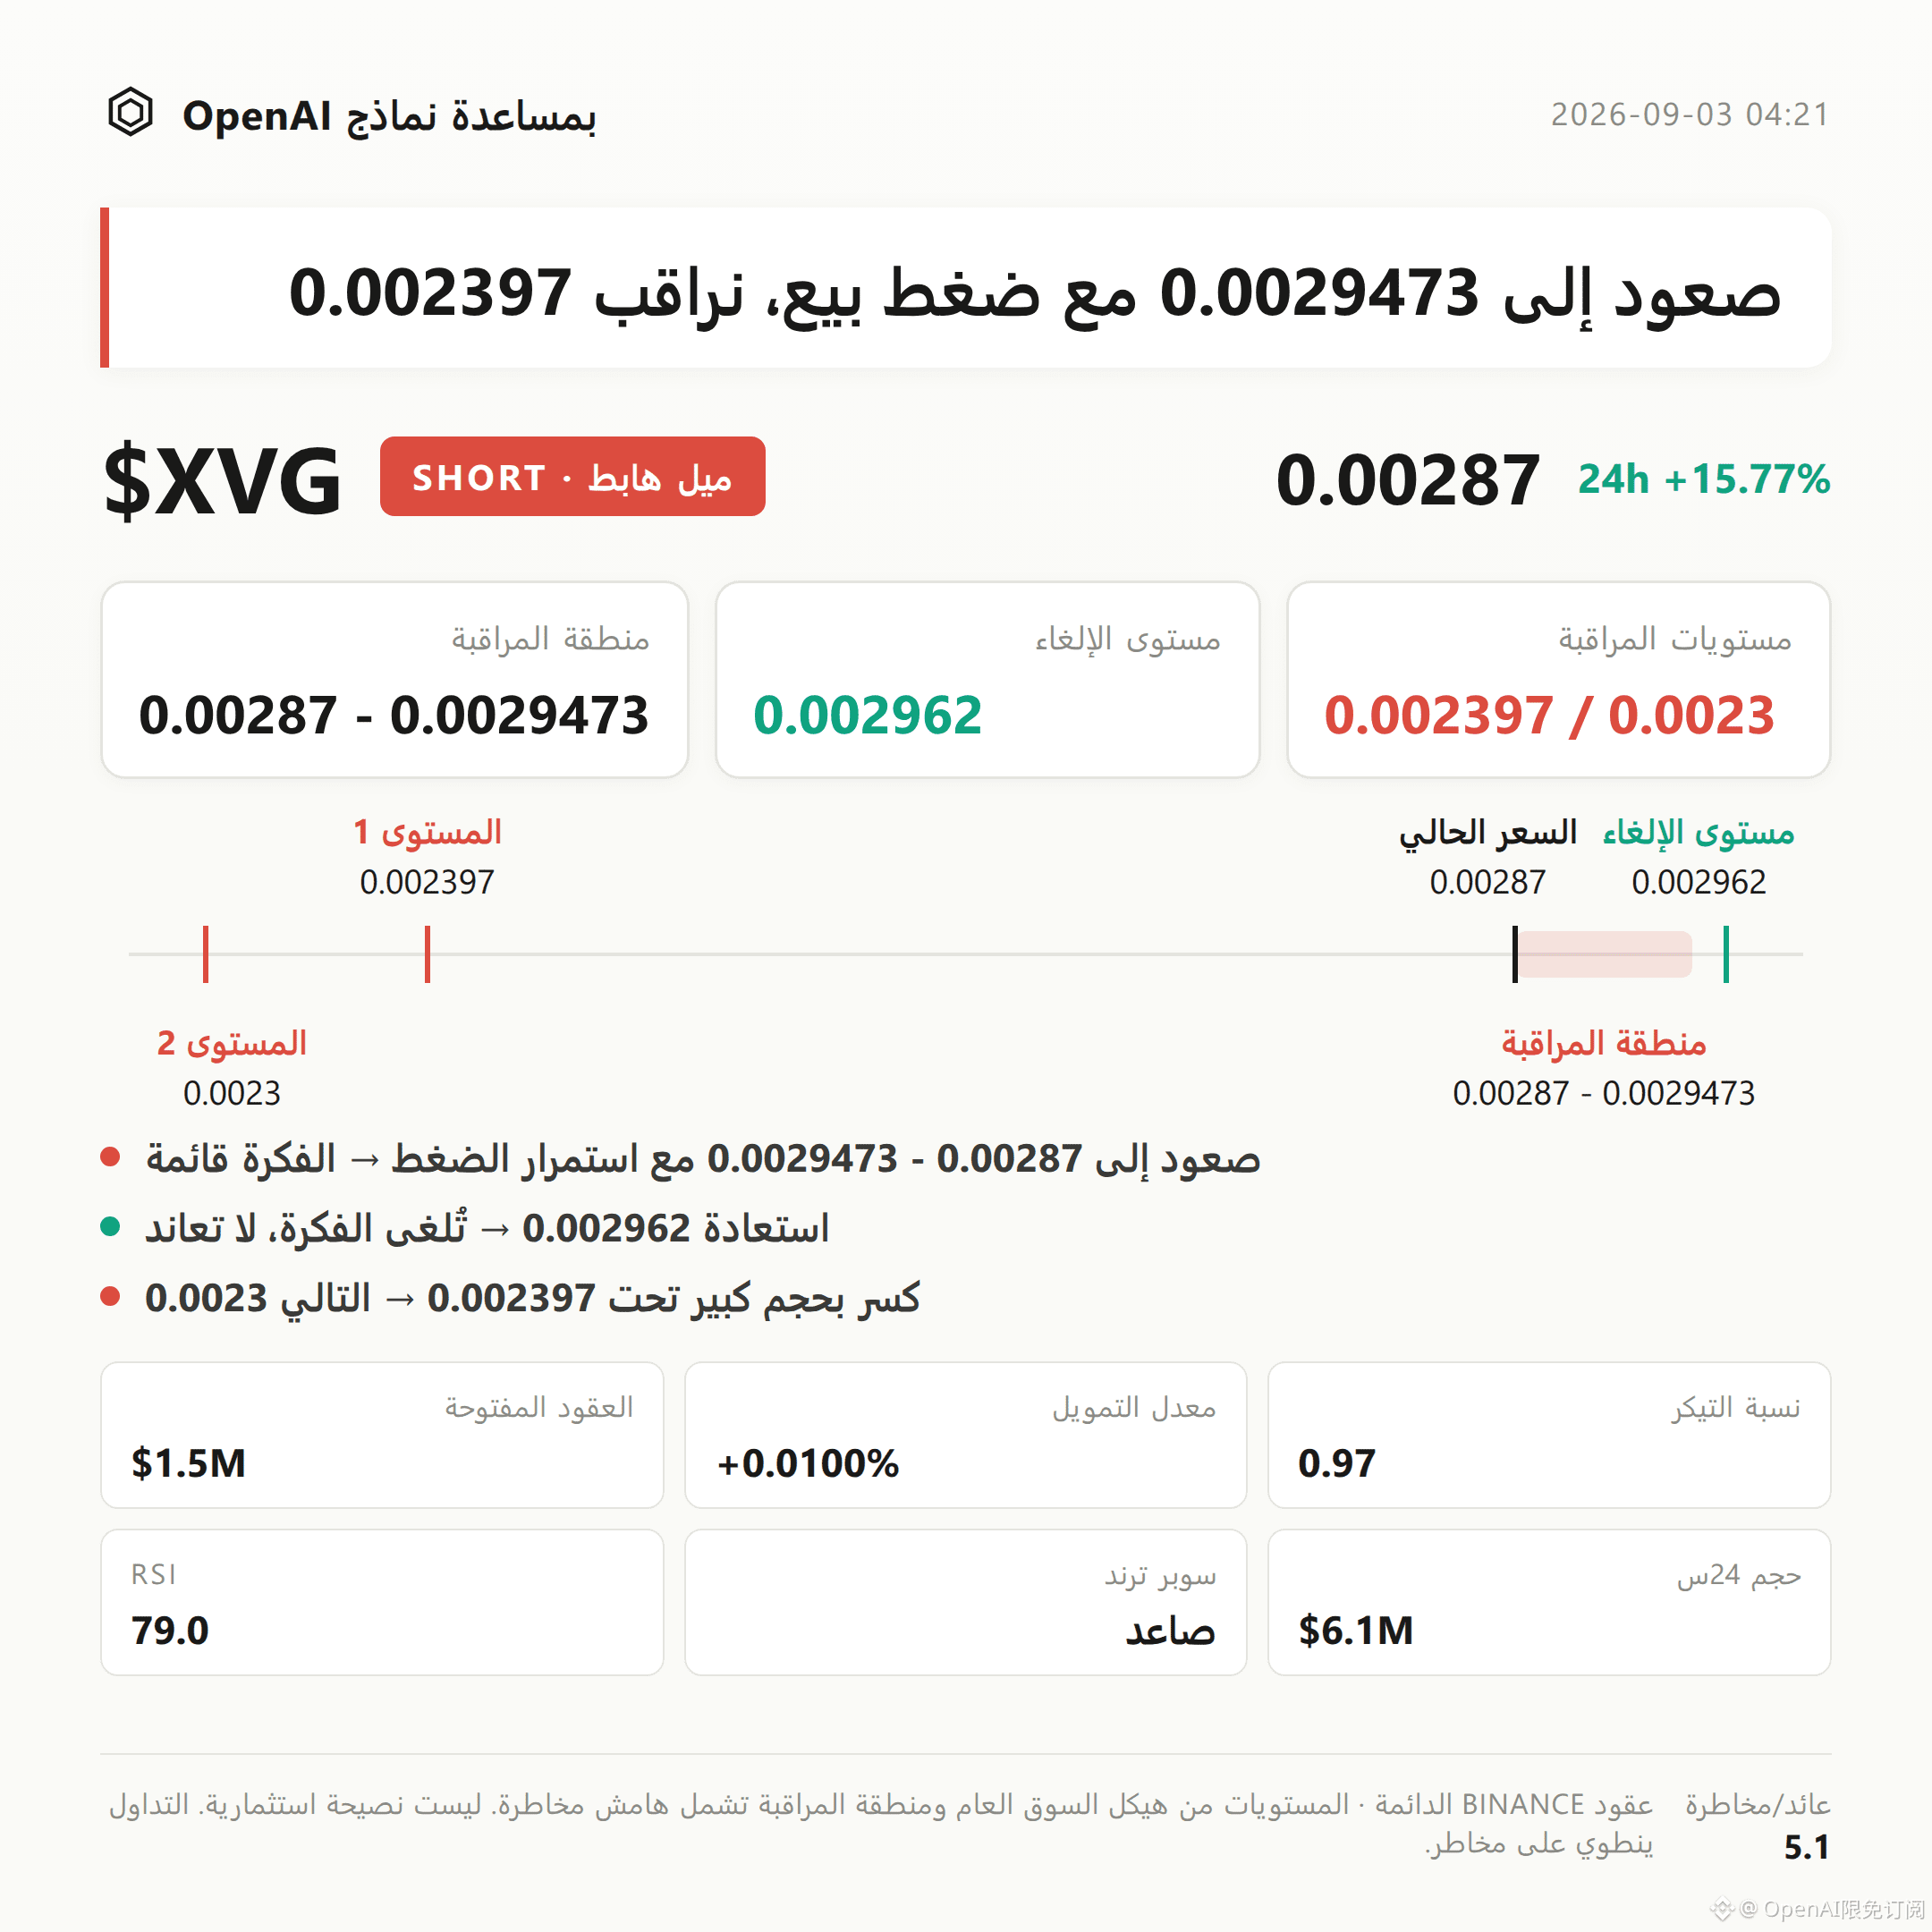
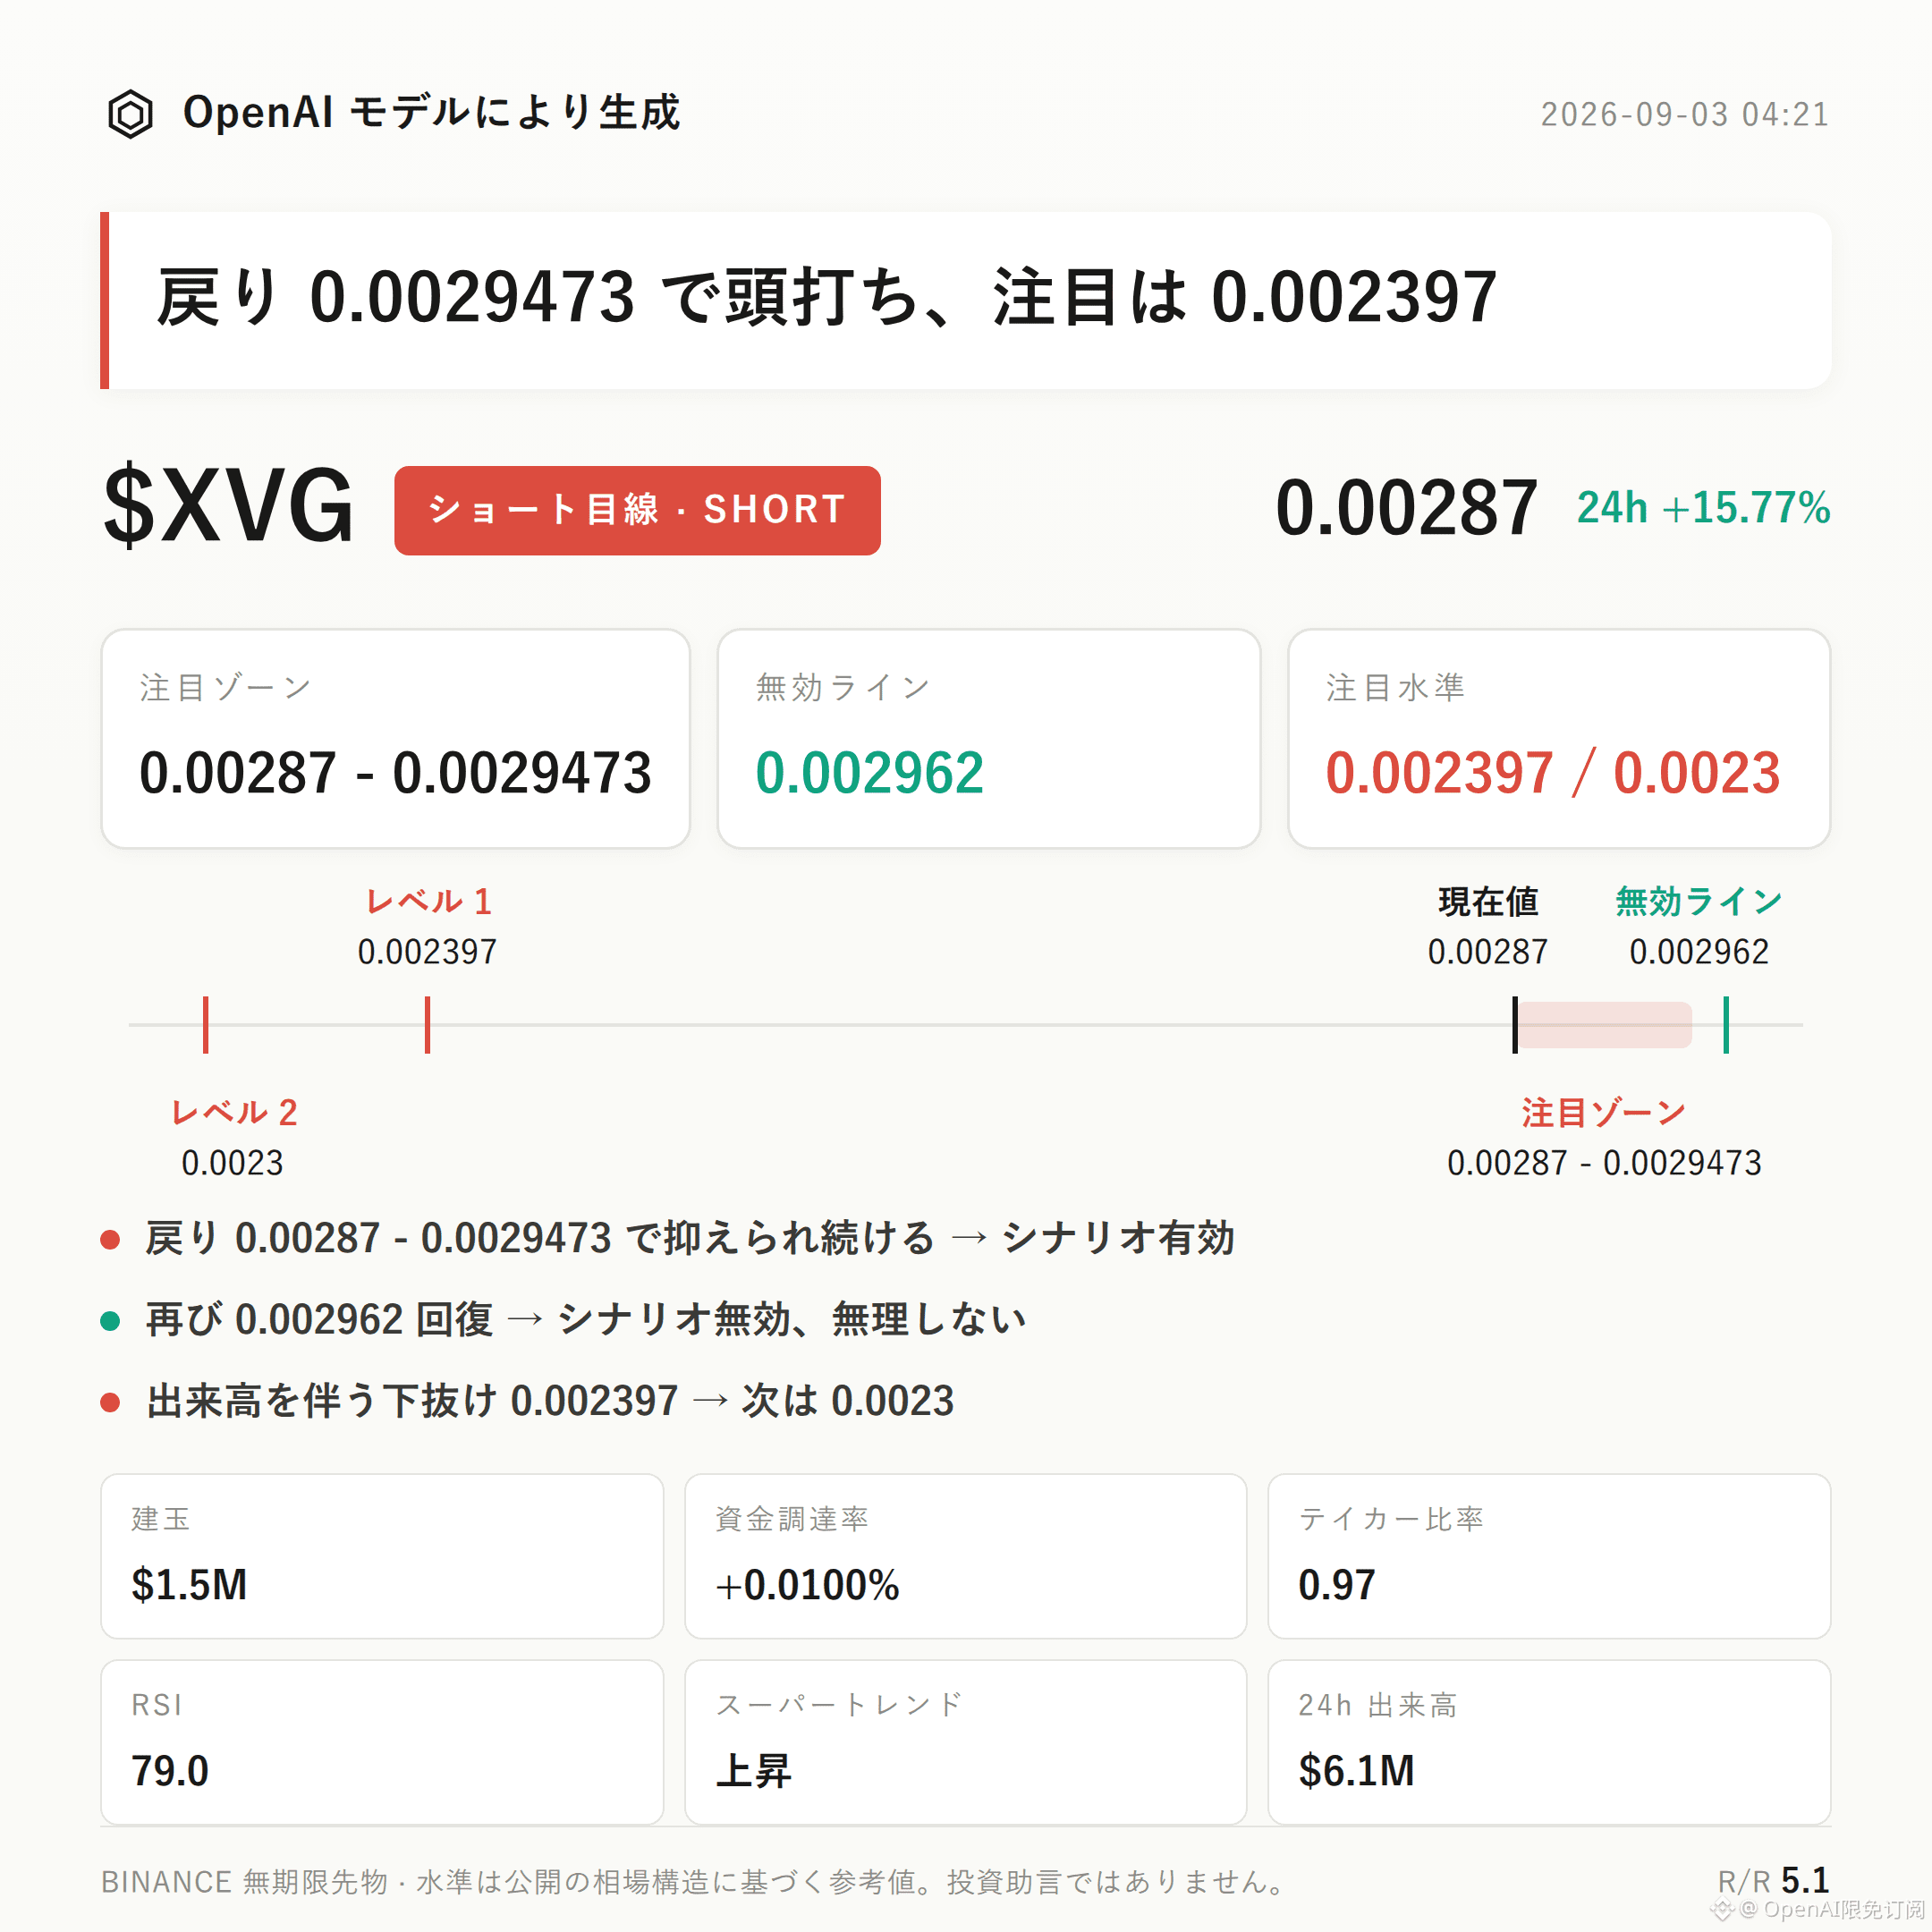
$XVG bearish-leaning plan | Focus Zone 0.00287 - 0.0029473 | Invalidation Reference 0.002962 | Observation Levels 0.002397 / 0.0023
$XVG ’s current bearish-leaning structure is playing out.
There are three core points: (1) RSI has surged to the overbought zone at 79.0. While the price has risen 15.77% over the past 24 hours, the open interest has jumped 46.4%, suggesting breakout-chasing participants are rapidly crowding in by leveraging. Meanwhile, the buy/sell ratio by active orders is only 0.97, indicating that the strength of active buying has not fully kept up with the price’s upward move—creating a divergence between momentum and participation.
Going forward, the key is whether the pullback rally can be capped within the focus zone, thereby confirming whether the retracement structure is indeed forming.
The recent high is 0.002962, and the recent low is 0.002397. The current price is 0.00287, which has moved above the upper Bollinger Band (0.0028; middle band 0.0026, lower band 0.0023). With RSI at 79.0 in overbought territory, it suggests that short-term momentum has already been overstretched.
However, MACD still shows bullish momentum, and the Super Trend indicator remains in an upward state. This implies that the larger trend itself has not yet turned bearish; therefore, the near-term pullback is more likely a structural cooling-off rather than a trend reversal. We need price action to confirm step by step.
On the derivatives side, crowded positioning is also being highlighted: the past 24-hour trading value is about $6.10 million, open interest is about $1.54 million, and it has surged 46.4% in 24 hours—showing that contract positions are expanding rapidly. Funding rate is +0.0100%, meaning longs are still paying fees for holding positions. The long/short ratio shows longs account for 63%, so positioning is skewed one-sided. The active buy/sell ratio is 0.97; together with the price’s strong rally, this creates a slight divergence—another piece of evidence that short-term sentiment is overheated.
The reference zone can be matched under the following conditions: if the price retraces to the focus zone 0.00287 - 0.0029473 but fails to hold effectively and instead shows a pressure-driven pullback, then the bearish-leaning thesis remains valid; if price reclaims the invalidation reference level 0.002962, that indicates the current pullback structure has been broken, and the thesis should be treated as invalid—do not continue using it. If price stays weak and breaks below the observation level 0.002397 with volume, you can further observe how support behaves near 0.0023; the reference risk/reward ratio is 5.1.
It is important to be honest: aside from the RSI overbought condition and the divergence between open interest/rally size, there are no obvious bearish reversal signals. MACD bullish momentum and the Super Trend’s upward reading are still indicating the broader trend remains bullish. It cannot be ruled out that price continues along the existing trend—this is the main downside risk to this thesis.
With contract leverage, position discipline is more important than directional judgment.
Additional note from a live account: $FOGO long positions are still being held. Personally, I remain bullish on the medium-term structure within it.
For reference only and does not constitute investment advice. Contracts involve leverage; investing involves risk.
This article was generated with assistance from an OpenAI large model.
$XVG
#Contract Analysis
$XVG bearish-leaning plan | Focus Zone 0.00287 - 0.0029473 | Invalidation Reference 0.002962 | Observation Levels 0.002397 / 0.0023
$XVG ’s current bearish-leaning structure is playing out.
There are three core points: (1) RSI has surged to the overbought zone at 79.0. While the price has risen 15.77% over the past 24 hours, the open interest has jumped 46.4%, suggesting breakout-chasing participants are rapidly crowding in by leveraging. Meanwhile, the buy/sell ratio by active orders is only 0.97, indicating that the strength of active buying has not fully kept up with the price’s upward move—creating a divergence between momentum and participation.
Going forward, the key is whether the pullback rally can be capped within the focus zone, thereby confirming whether the retracement structure is indeed forming.
The recent high is 0.002962, and the recent low is 0.002397. The current price is 0.00287, which has moved above the upper Bollinger Band (0.0028; middle band 0.0026, lower band 0.0023). With RSI at 79.0 in overbought territory, it suggests that short-term momentum has already been overstretched.
However, MACD still shows bullish momentum, and the Super Trend indicator remains in an upward state. This implies that the larger trend itself has not yet turned bearish; therefore, the near-term pullback is more likely a structural cooling-off rather than a trend reversal. We need price action to confirm step by step.
On the derivatives side, crowded positioning is also being highlighted: the past 24-hour trading value is about $6.10 million, open interest is about $1.54 million, and it has surged 46.4% in 24 hours—showing that contract positions are expanding rapidly. Funding rate is +0.0100%, meaning longs are still paying fees for holding positions. The long/short ratio shows longs account for 63%, so positioning is skewed one-sided. The active buy/sell ratio is 0.97; together with the price’s strong rally, this creates a slight divergence—another piece of evidence that short-term sentiment is overheated.
The reference zone can be matched under the following conditions: if the price retraces to the focus zone 0.00287 - 0.0029473 but fails to hold effectively and instead shows a pressure-driven pullback, then the bearish-leaning thesis remains valid; if price reclaims the invalidation reference level 0.002962, that indicates the current pullback structure has been broken, and the thesis should be treated as invalid—do not continue using it. If price stays weak and breaks below the observation level 0.002397 with volume, you can further observe how support behaves near 0.0023; the reference risk/reward ratio is 5.1.
It is important to be honest: aside from the RSI overbought condition and the divergence between open interest/rally size, there are no obvious bearish reversal signals. MACD bullish momentum and the Super Trend’s upward reading are still indicating the broader trend remains bullish. It cannot be ruled out that price continues along the existing trend—this is the main downside risk to this thesis.
With contract leverage, position discipline is more important than directional judgment.
Additional note from a live account: $FOGO long positions are still being held. Personally, I remain bullish on the medium-term structure within it.
For reference only and does not constitute investment advice. Contracts involve leverage; investing involves risk.
This article was generated with assistance from an OpenAI large model.
$XVG
#Contract Analysis