Trading Rationale|9/3 03:21
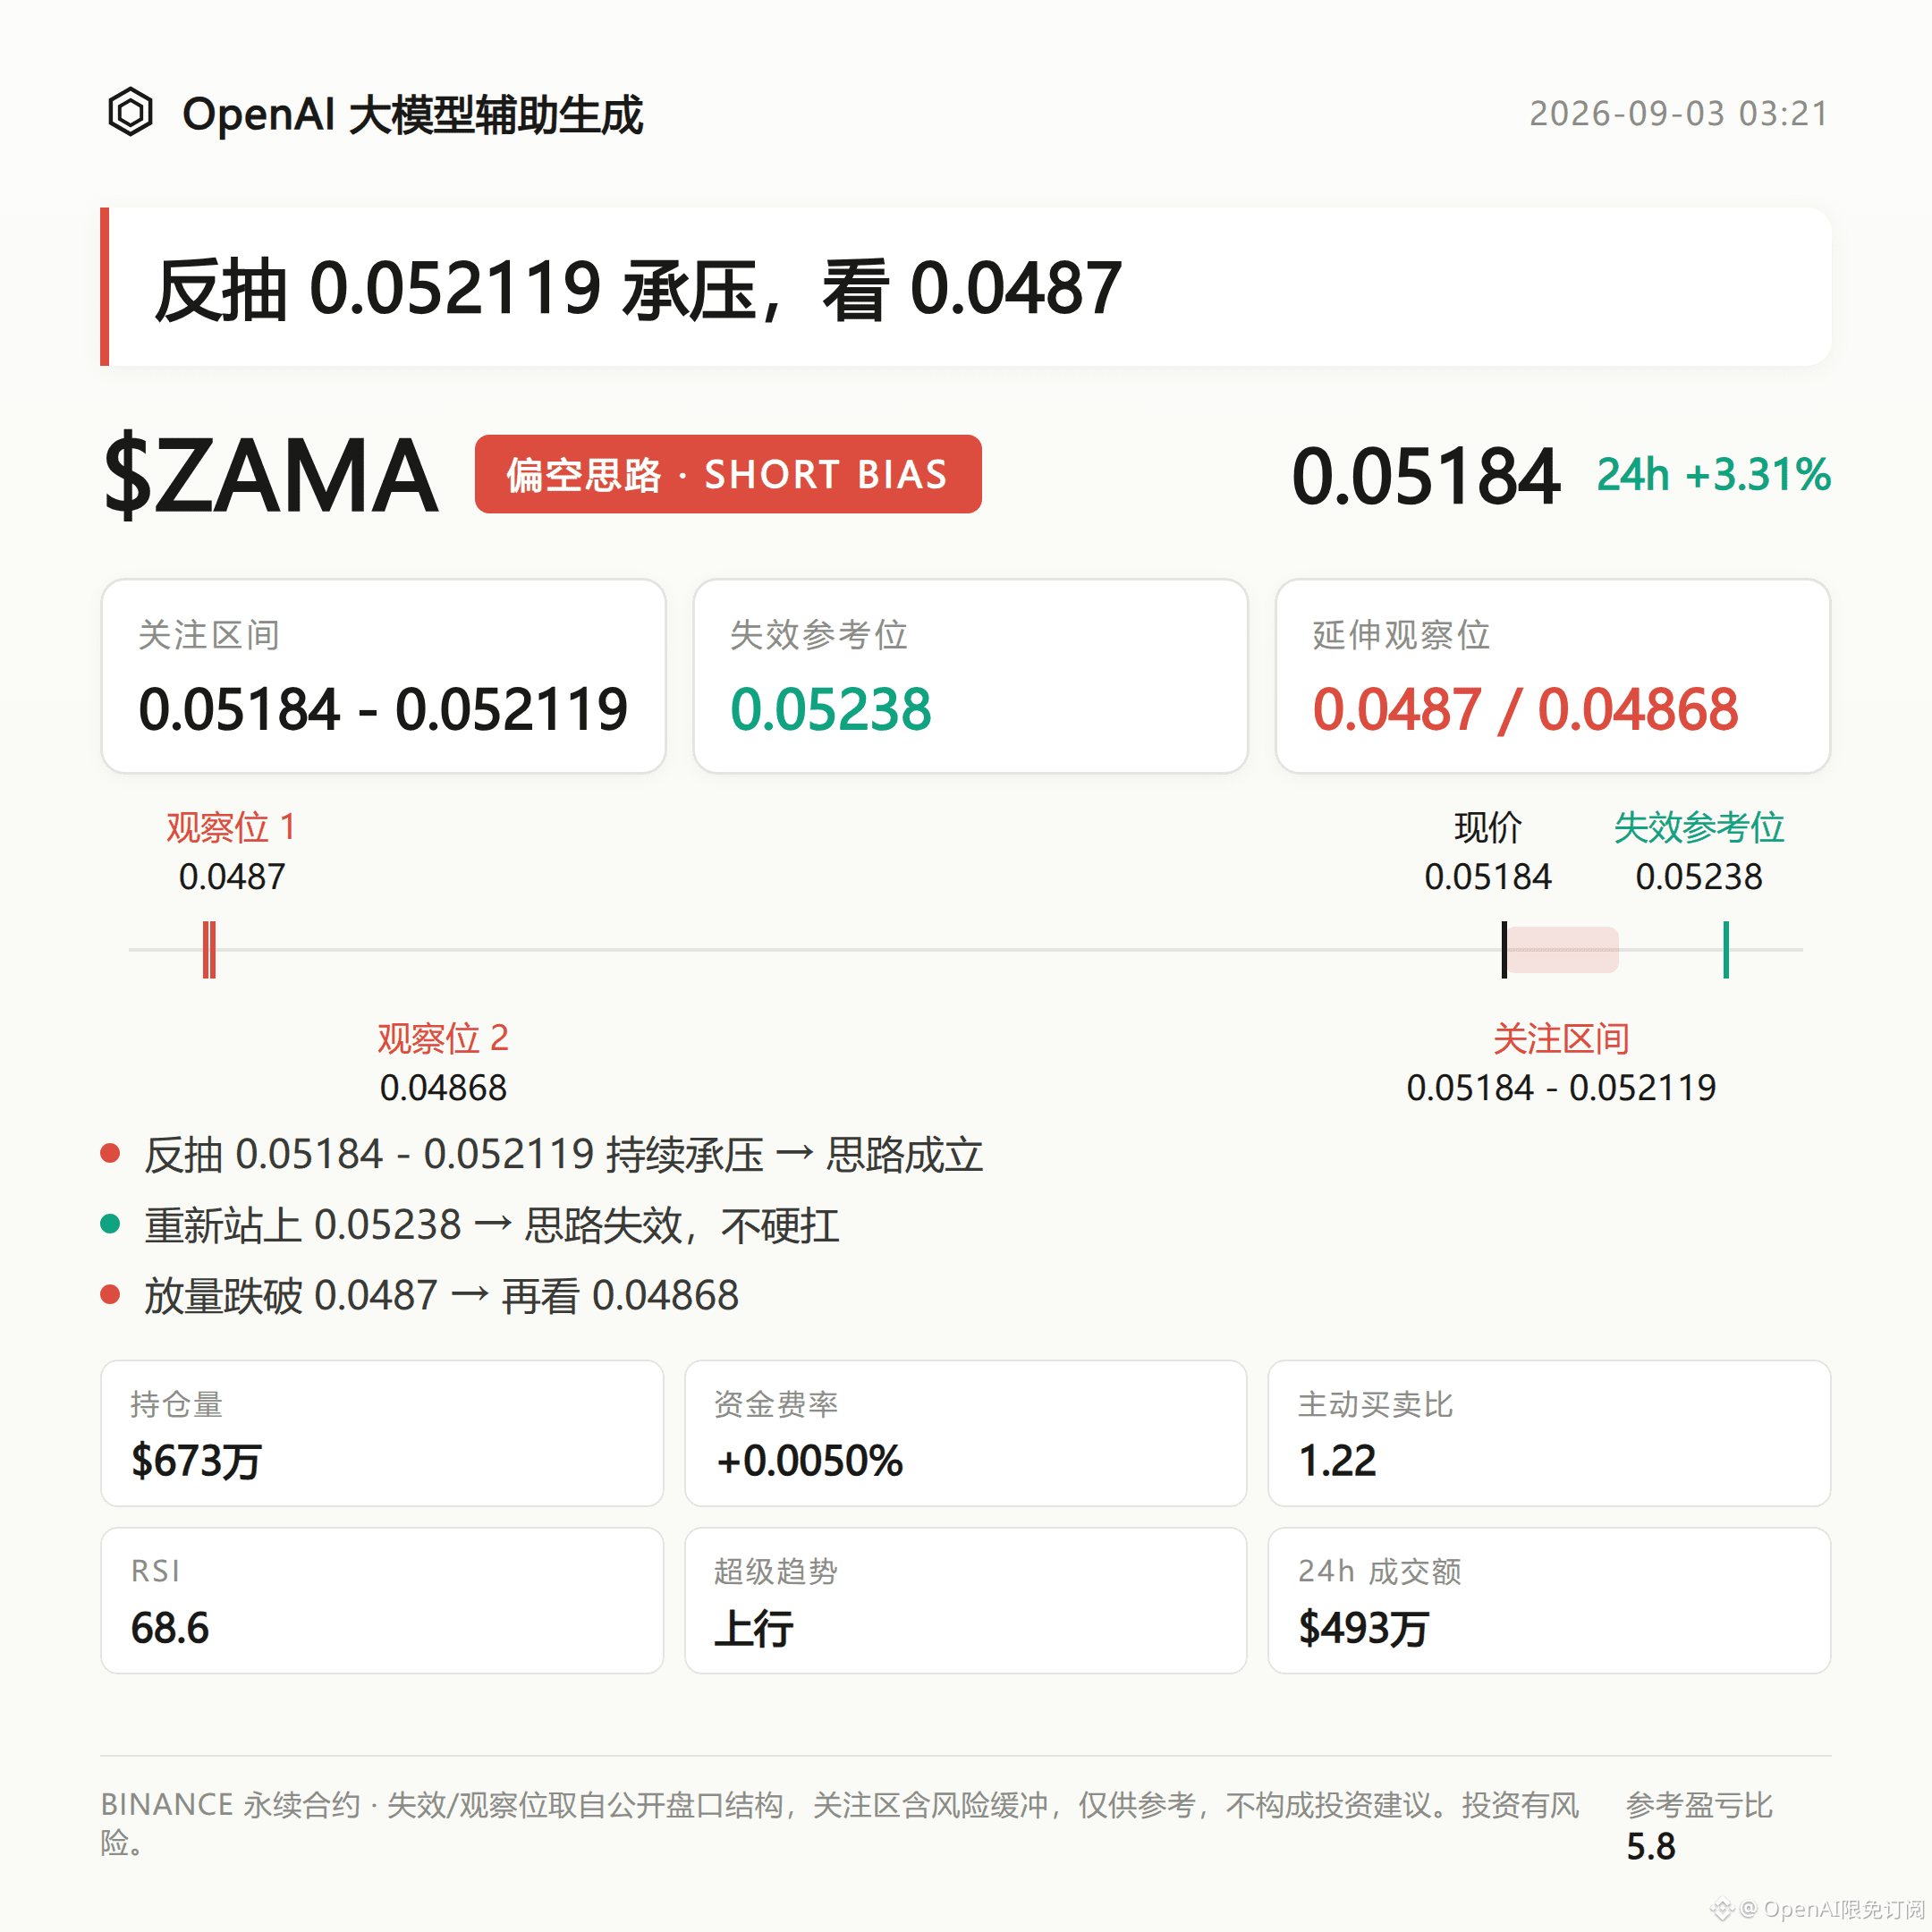
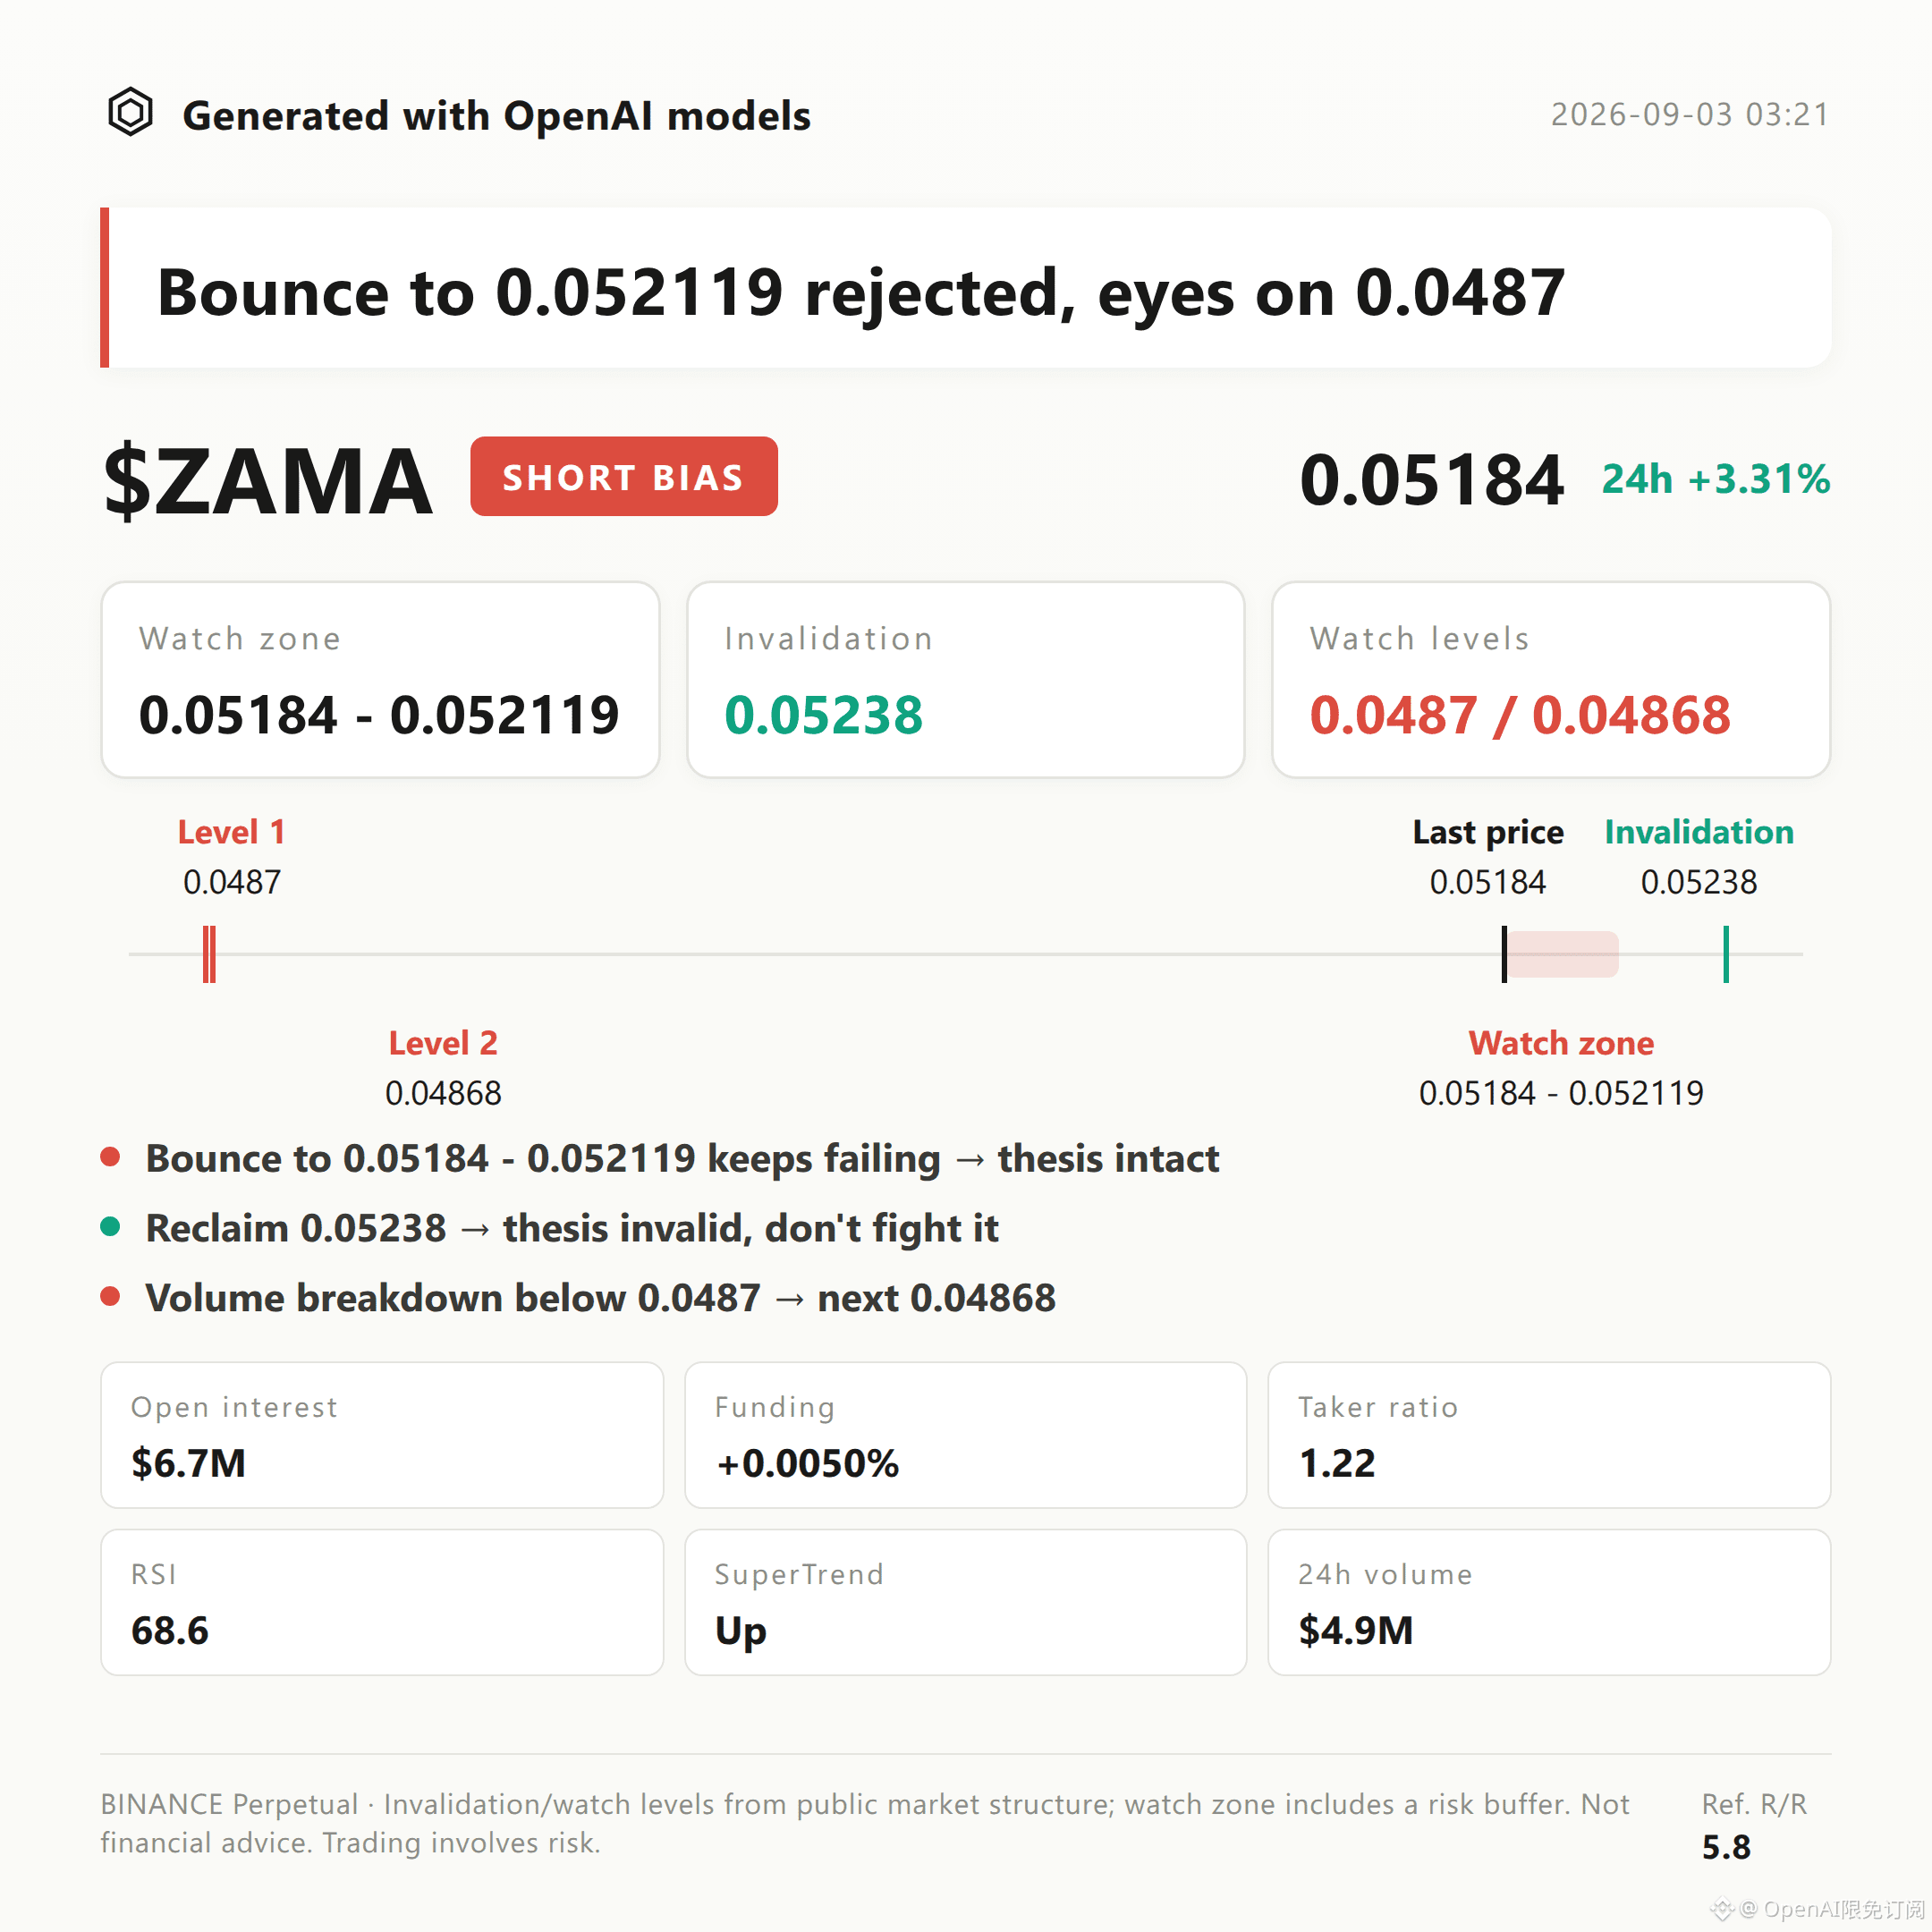
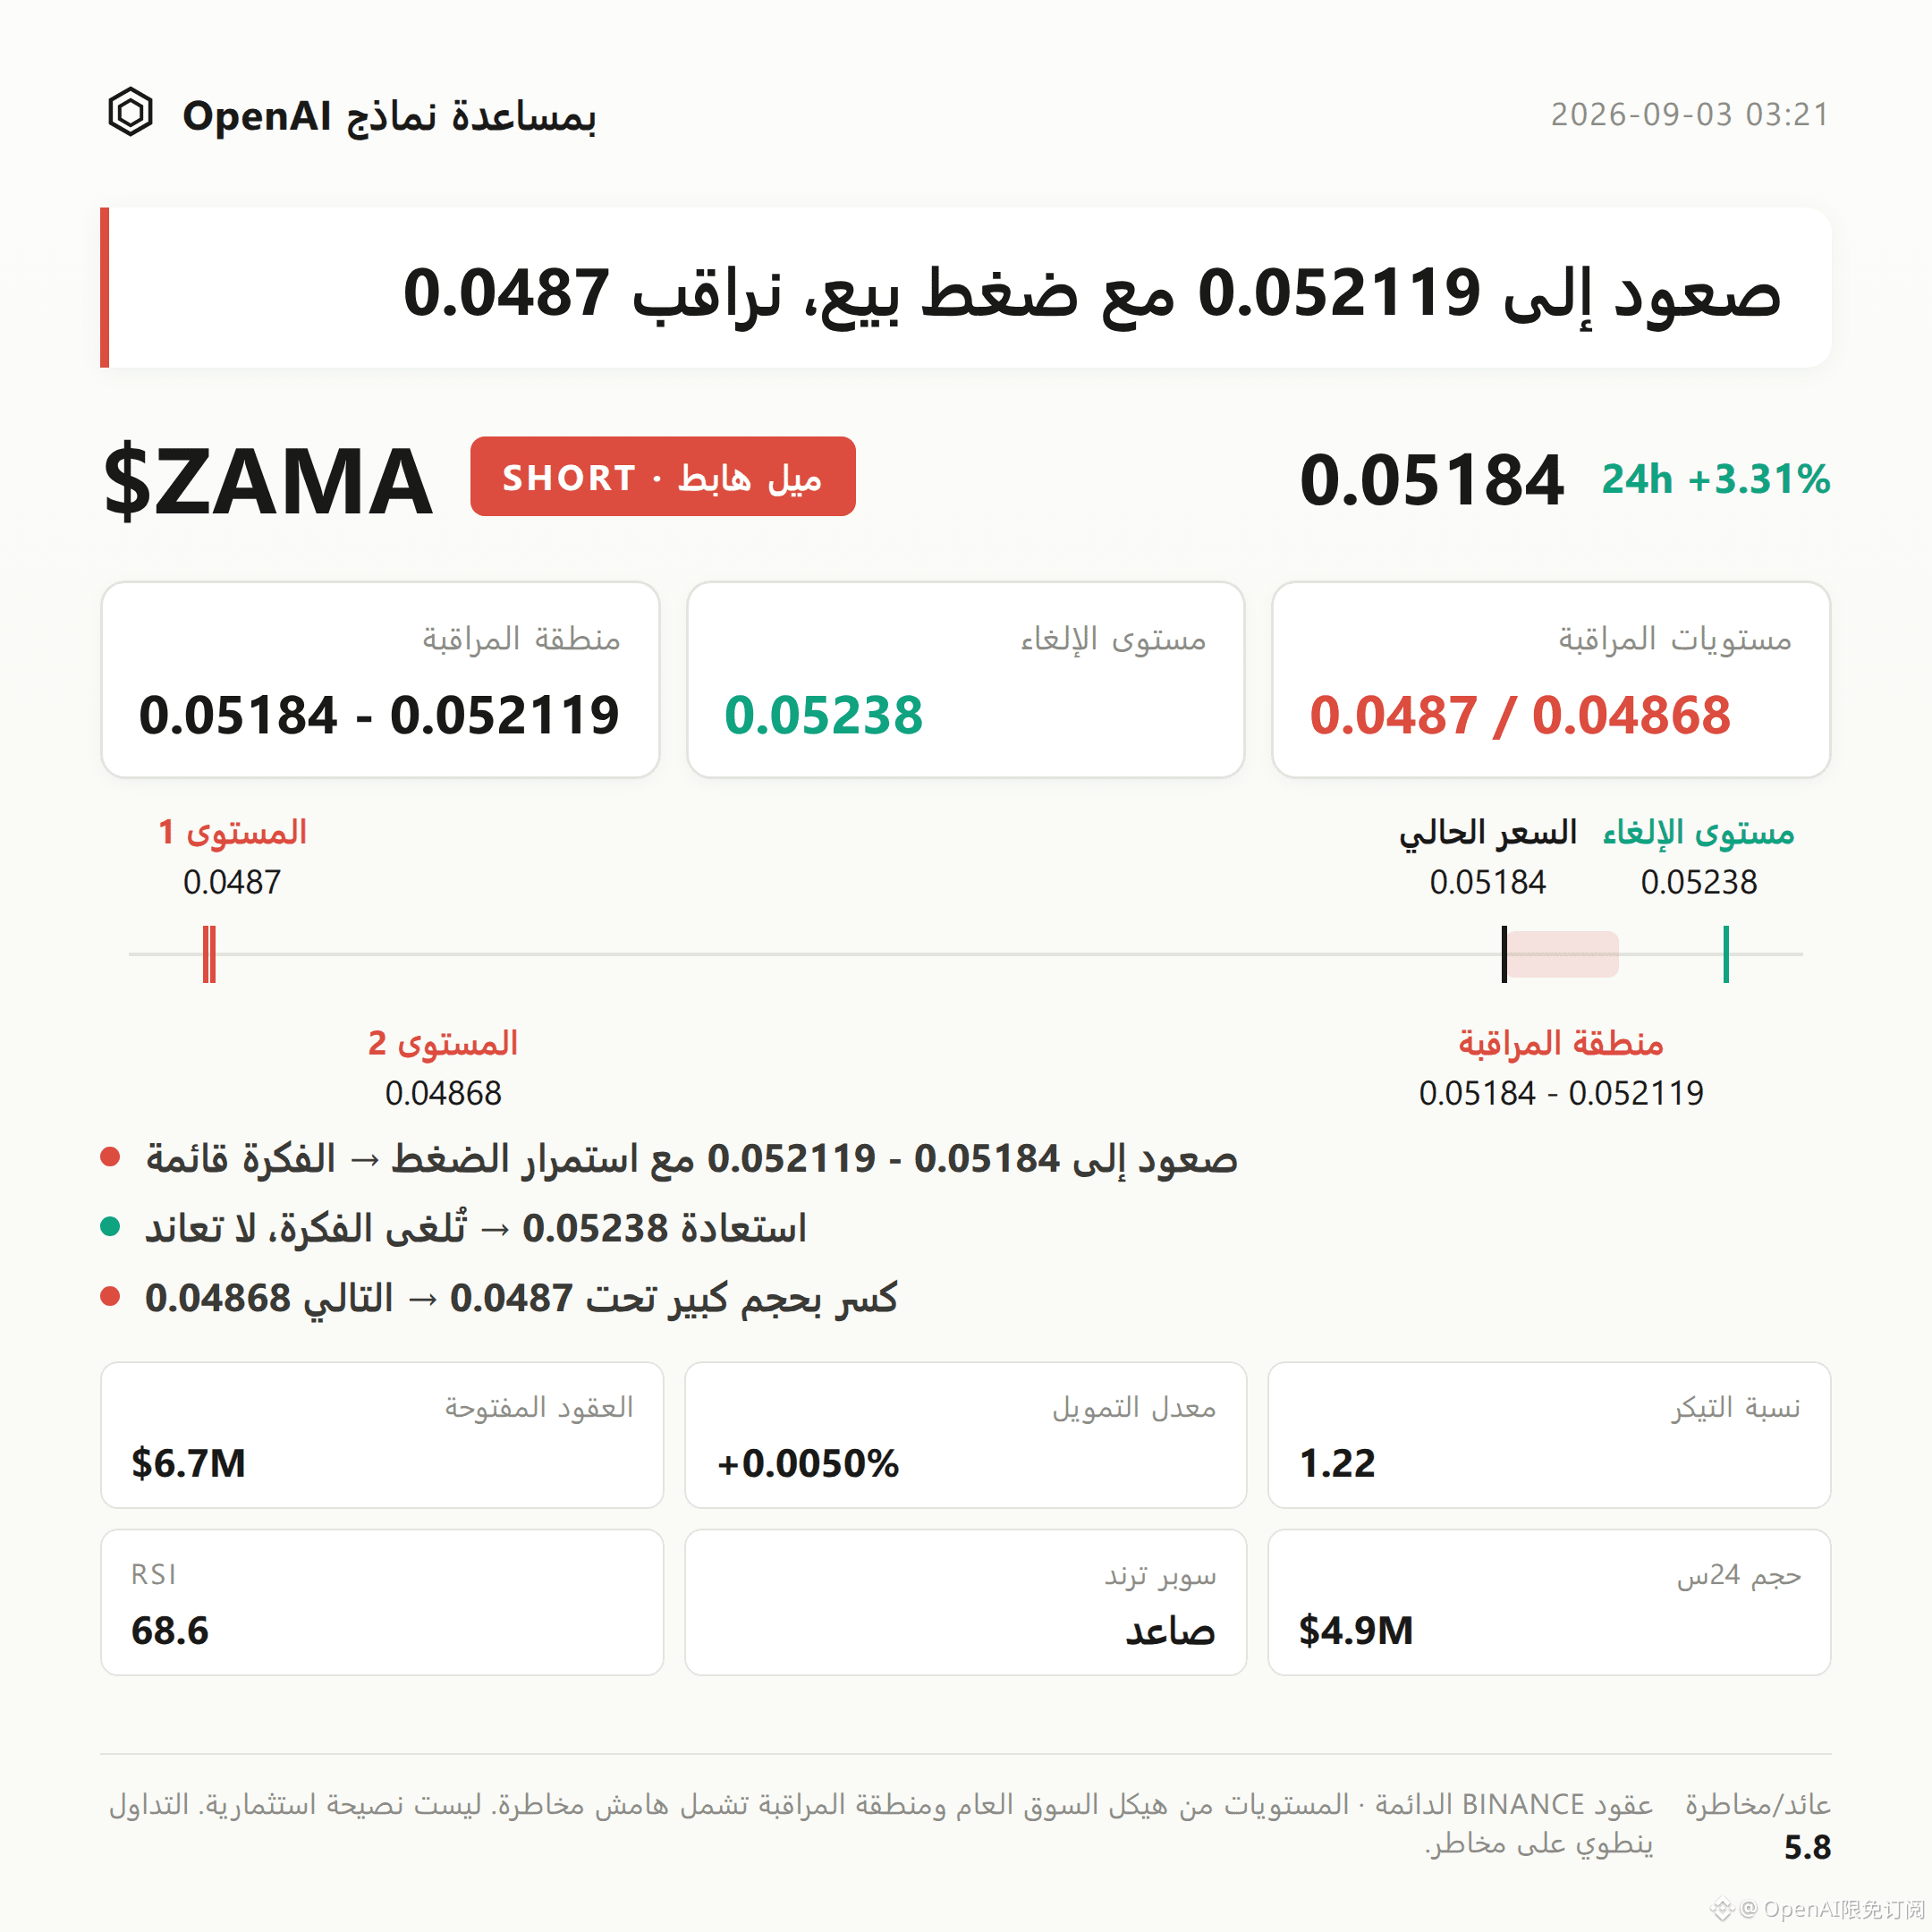
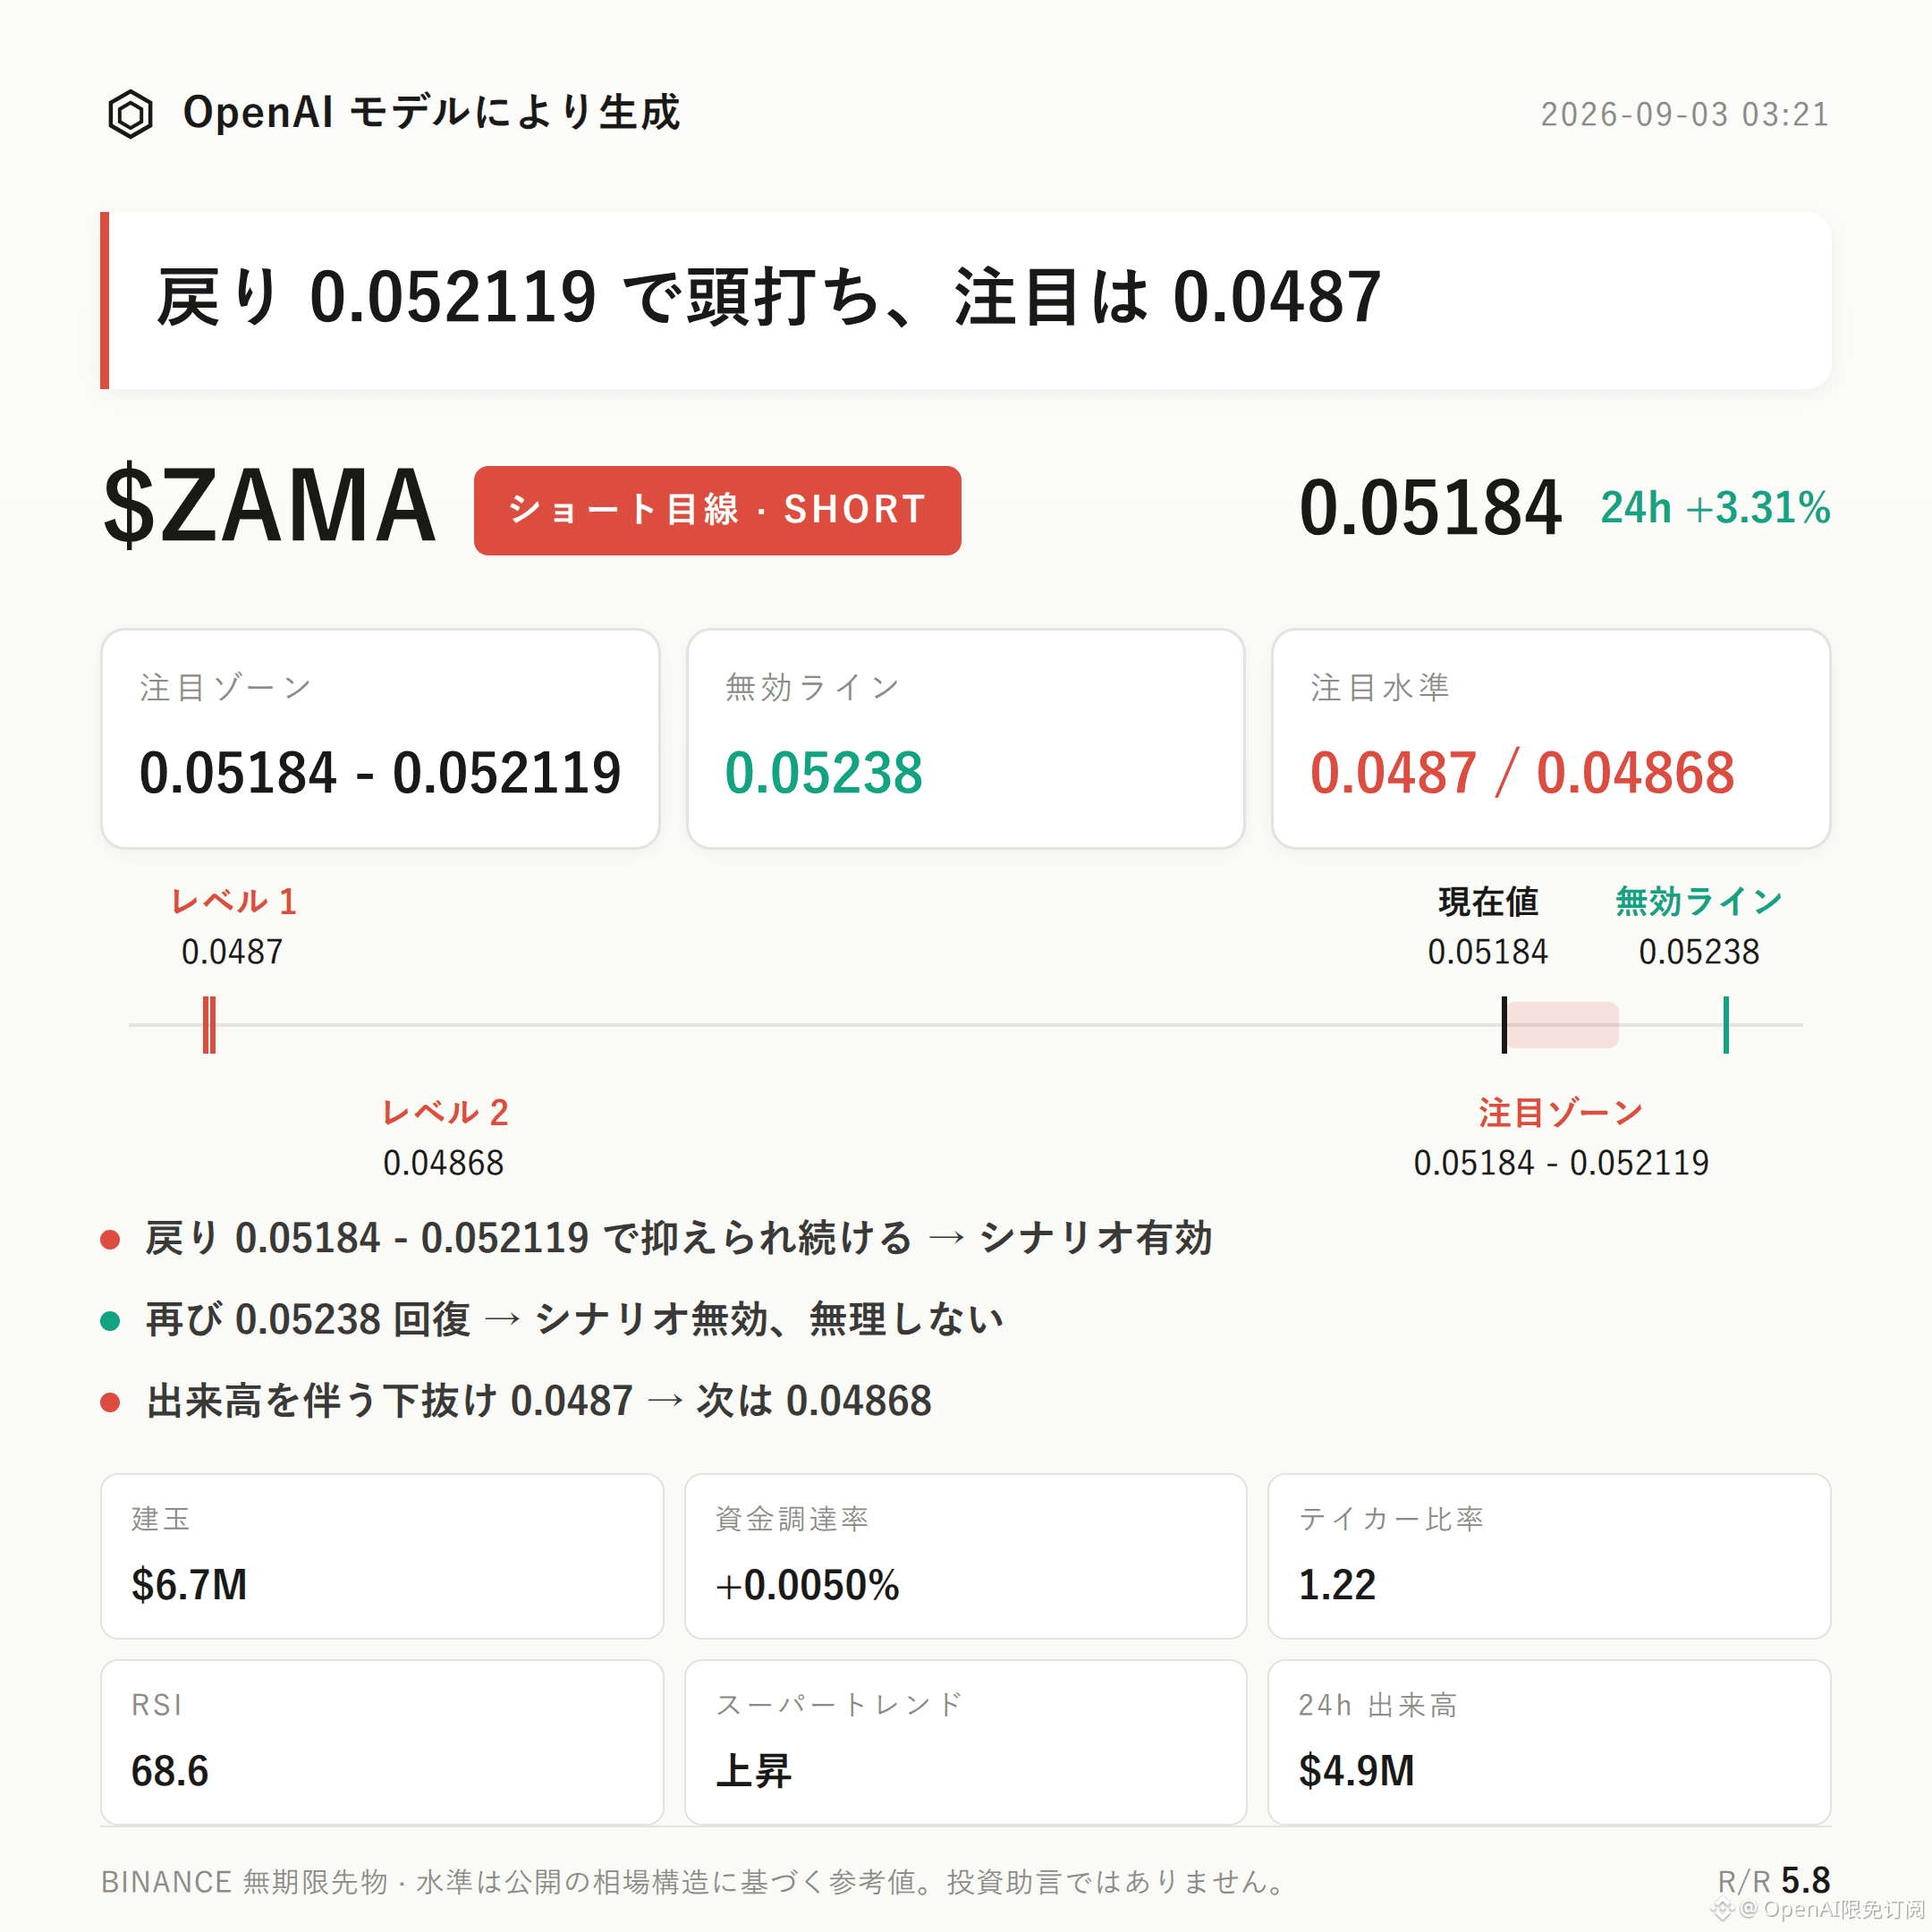
$ZAMA bearish-leaning approach | Focus range 0.05184 - 0.052119 | Invalidation reference 0.05238 | Observation levels 0.0487 / 0.04868
$ZAMA The current structure is leaning bearish and is still unfolding.
There are three core points: RSI has risen to 68.6, entering an overheated zone; the current price 0.05184 has moved above the upper Bollinger Band of 0.0514; price is approaching the recent high at 0.05238, but no effective breakout has formed yet.
The validation mainly hinges on whether the pullback can be capped in the resistance area—if the pullback lacks strength, the bearish structure is confirmed.
Structurally, the recent high 0.05238 and the recent low 0.04868 form the current trading range, and the current price 0.05184 is already close to the upper edge of that range.
Bollinger Bands show the upper band at 0.0514, the mid band at 0.0501, and the lower band at 0.0487. Price is trading outside the upper band, indicating a somewhat strong extension; at the same time, it also implies short-term pressure for mean reversion.
The SuperTrend indicator shows an uptrend, and MACD shows bullish momentum. These two indicators are still relatively bullish and should be viewed together with the RSI overheating signal—neither should be used alone as the directional basis.
RSI at 68.6 is nearing the overbought zone, which is the main trigger for this bearish-leaning idea.
24-hour trading volume is about $4.93M, with open interest around $6.73M. The 24-hour change in open interest is +4.6%, suggesting new positions have recently entered, but we cannot yet judge whether the direction of those entries will persist.
Funding rate is +0.0050%, a mildly positive value. Bulls have a slight edge, but the level is not extreme.
For the long-vs-short account ratio: longs account for 43%, which is not overwhelmingly one-sided toward longs by account count.
It needs to be stated plainly: the aggressive buy/sell ratio is 1.22, meaning buy-side成交 is still relatively strong—this conflicts with the bearish-leaning argument based on RSI overheating pullback. This is the biggest upside risk against the bearish thesis. If aggressive buying continues to expand in volume, the pullback rhythm could be interrupted or even delayed.
For the reference range, start by watching 0.05184 to 0.052119. It is more suitable to wait for signs of resistance and rejection from a pullback in this area before confirming, rather than assuming the pullback has already happened directly.
If the pullback meets resistance in the focus zone and falls, the bearish-structure thesis holds.
If the price reclaims 0.05238, it means the current pullback structure has been broken—then the bearish idea is invalid and should not be continued based on the original assumption.
If the structure continues to lean bearish and breaks down further with volume below 0.0487, you can then consider the support performance near 0.04868.
Need to emphasize again: the aggressive buy/sell ratio of 1.22 shows buy-side pressure is still relatively strong. Combined with MACD bullish momentum and SuperTrend uptrend still not weakening, there is a possibility the bearish thesis could be interrupted. This is not a certain conclusion.
The reference risk-reward of 5.8 is only structural context and does not represent the actual outcome.
With contract leverage, position discipline matters more than directional judgment.
Live account disclosure: This account currently holds $FOGO long positions; structurally, we continue to look for upside, and the view is consistent with the position.
For reference only and does not constitute investment advice. Contracts have a杠
$ZAMA bearish-leaning approach | Focus range 0.05184 - 0.052119 | Invalidation reference 0.05238 | Observation levels 0.0487 / 0.04868
$ZAMA The current structure is leaning bearish and is still unfolding.
There are three core points: RSI has risen to 68.6, entering an overheated zone; the current price 0.05184 has moved above the upper Bollinger Band of 0.0514; price is approaching the recent high at 0.05238, but no effective breakout has formed yet.
The validation mainly hinges on whether the pullback can be capped in the resistance area—if the pullback lacks strength, the bearish structure is confirmed.
Structurally, the recent high 0.05238 and the recent low 0.04868 form the current trading range, and the current price 0.05184 is already close to the upper edge of that range.
Bollinger Bands show the upper band at 0.0514, the mid band at 0.0501, and the lower band at 0.0487. Price is trading outside the upper band, indicating a somewhat strong extension; at the same time, it also implies short-term pressure for mean reversion.
The SuperTrend indicator shows an uptrend, and MACD shows bullish momentum. These two indicators are still relatively bullish and should be viewed together with the RSI overheating signal—neither should be used alone as the directional basis.
RSI at 68.6 is nearing the overbought zone, which is the main trigger for this bearish-leaning idea.
24-hour trading volume is about $4.93M, with open interest around $6.73M. The 24-hour change in open interest is +4.6%, suggesting new positions have recently entered, but we cannot yet judge whether the direction of those entries will persist.
Funding rate is +0.0050%, a mildly positive value. Bulls have a slight edge, but the level is not extreme.
For the long-vs-short account ratio: longs account for 43%, which is not overwhelmingly one-sided toward longs by account count.
It needs to be stated plainly: the aggressive buy/sell ratio is 1.22, meaning buy-side成交 is still relatively strong—this conflicts with the bearish-leaning argument based on RSI overheating pullback. This is the biggest upside risk against the bearish thesis. If aggressive buying continues to expand in volume, the pullback rhythm could be interrupted or even delayed.
For the reference range, start by watching 0.05184 to 0.052119. It is more suitable to wait for signs of resistance and rejection from a pullback in this area before confirming, rather than assuming the pullback has already happened directly.
If the pullback meets resistance in the focus zone and falls, the bearish-structure thesis holds.
If the price reclaims 0.05238, it means the current pullback structure has been broken—then the bearish idea is invalid and should not be continued based on the original assumption.
If the structure continues to lean bearish and breaks down further with volume below 0.0487, you can then consider the support performance near 0.04868.
Need to emphasize again: the aggressive buy/sell ratio of 1.22 shows buy-side pressure is still relatively strong. Combined with MACD bullish momentum and SuperTrend uptrend still not weakening, there is a possibility the bearish thesis could be interrupted. This is not a certain conclusion.
The reference risk-reward of 5.8 is only structural context and does not represent the actual outcome.
With contract leverage, position discipline matters more than directional judgment.
Live account disclosure: This account currently holds $FOGO long positions; structurally, we continue to look for upside, and the view is consistent with the position.
For reference only and does not constitute investment advice. Contracts have a杠