
If you’re just starting to learn trading, when you open a chart you’ll probably see countless lines, numbers, and indicators and you won’t know where to start. 😵💫
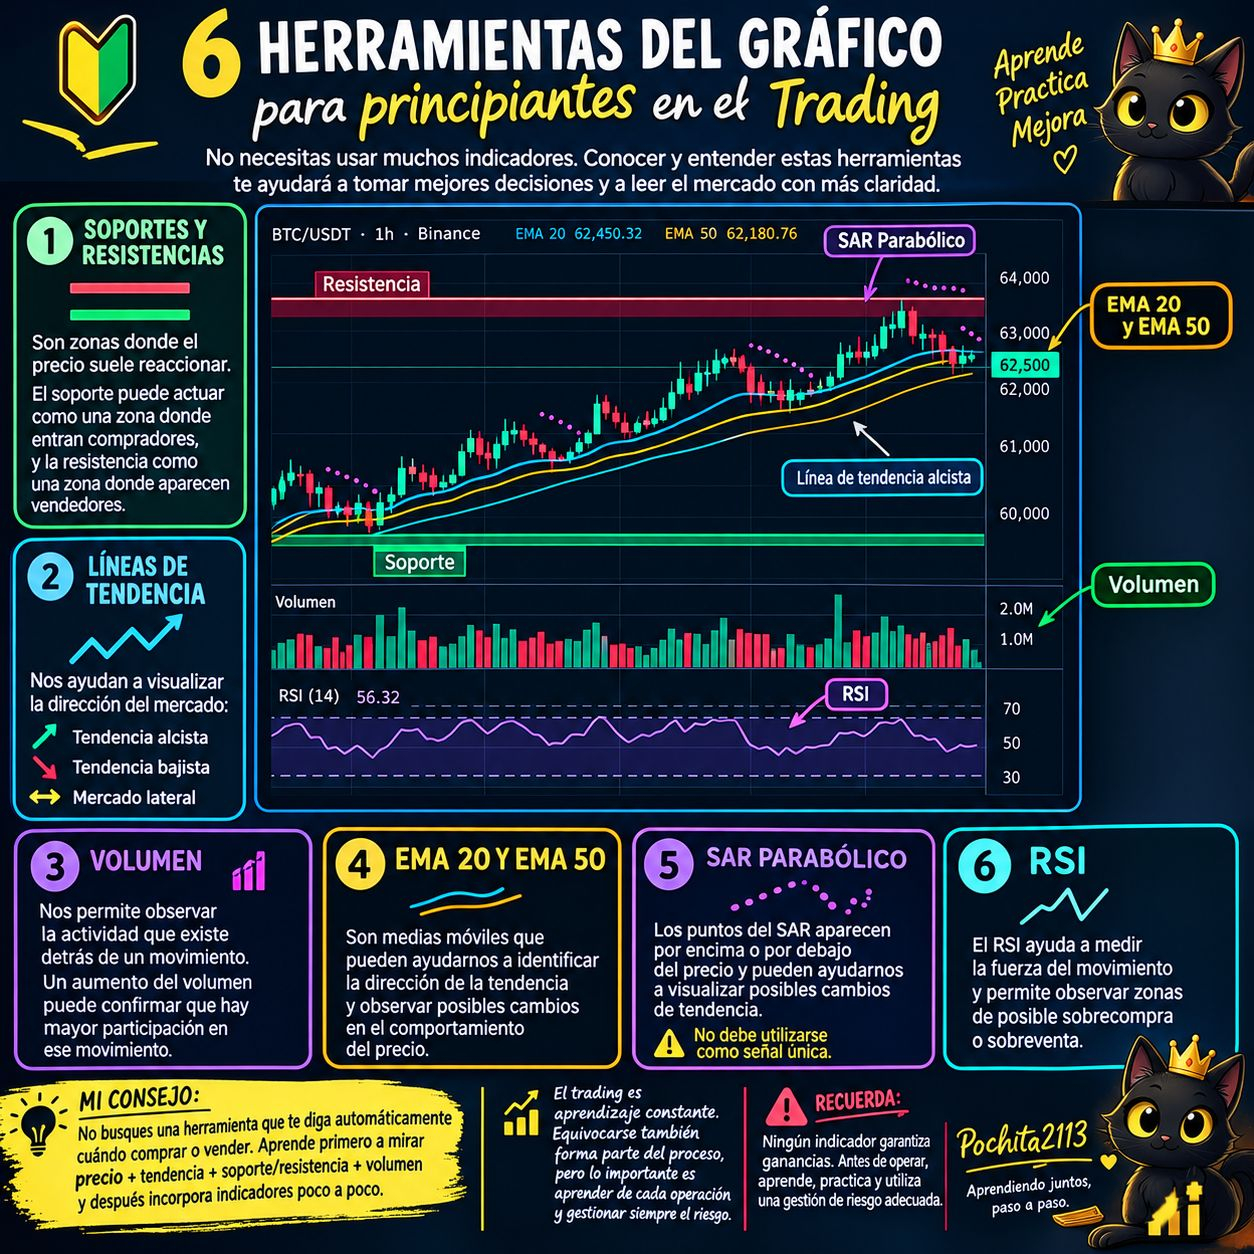
👉 You don’t need to use 20 indicators. What matters is learning to correctly interpret a few tools.
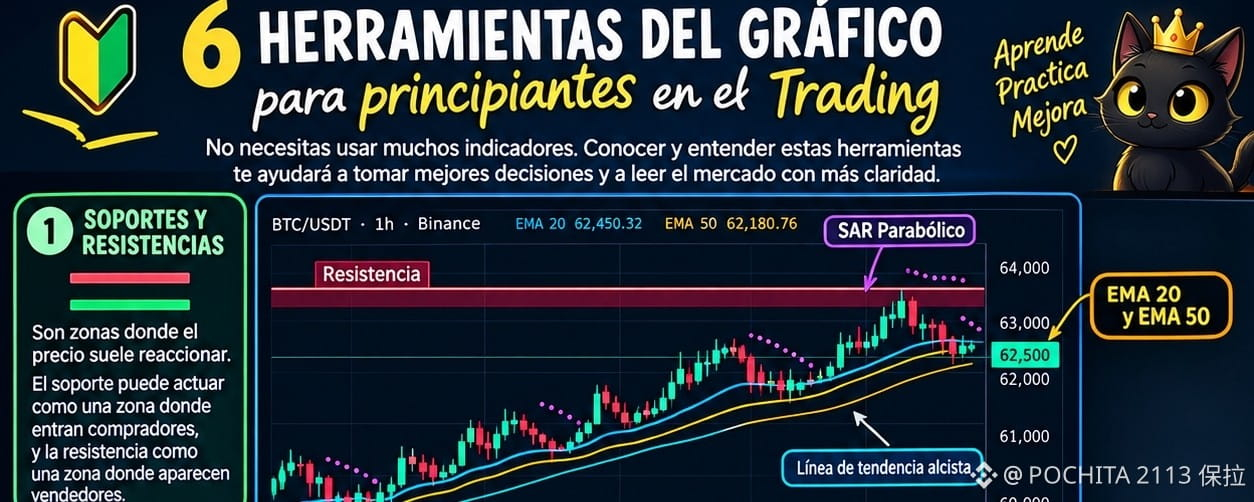
🔹 1. SUPPORTS AND RESISTANCES 🧱
These are zones where the price often reacts.
Support can act as an area where the price finds buyers, while resistance can be an area where sellers appear.
🔹 2. TREND LINES 📈📉
They help us visualize the direction of the market:
⬆️ Bullish trend
⬇️ Bearish trend
➡️ Sideways market
🔹 3. VOLUME 📊
It allows us to observe the activity that exists behind a movement. An increase in volume can help confirm that there is greater participation in that movement.
🔹 4. EMA 20 AND EMA 50 📈
These are moving averages that can help us identify the direction of the trend and observe possible changes in price behavior.
🔹 5. PARABOLIC SAR 🟣
The SAR points appear above or below the price and can help us visualize possible trend changes.
⚠️ It should not be used as the only signal.
🔹 6. RSI 📉
RSI helps measure the strength of the move and allows us to observe potential overbought or oversold zones.
💡 MY ADVICE FOR THOSE WHO ARE JUST STARTING:
Don’t look for a tool that automatically tells you when to buy or sell. First learn to look at price + trend + support/resistance + volume, and then incorporate indicators little by little.
📖 Trading is constant learning. Making mistakes is also part of the process, but the important thing is to learn from each trade and always manage risk.
🚨 Remember: no indicator guarantees profits. Before trading, learn, practice, and use proper risk management.
🐱 Pochita2113
💙 Learning together, step by step.
@Binance Global Türkçe #Binance $BNB