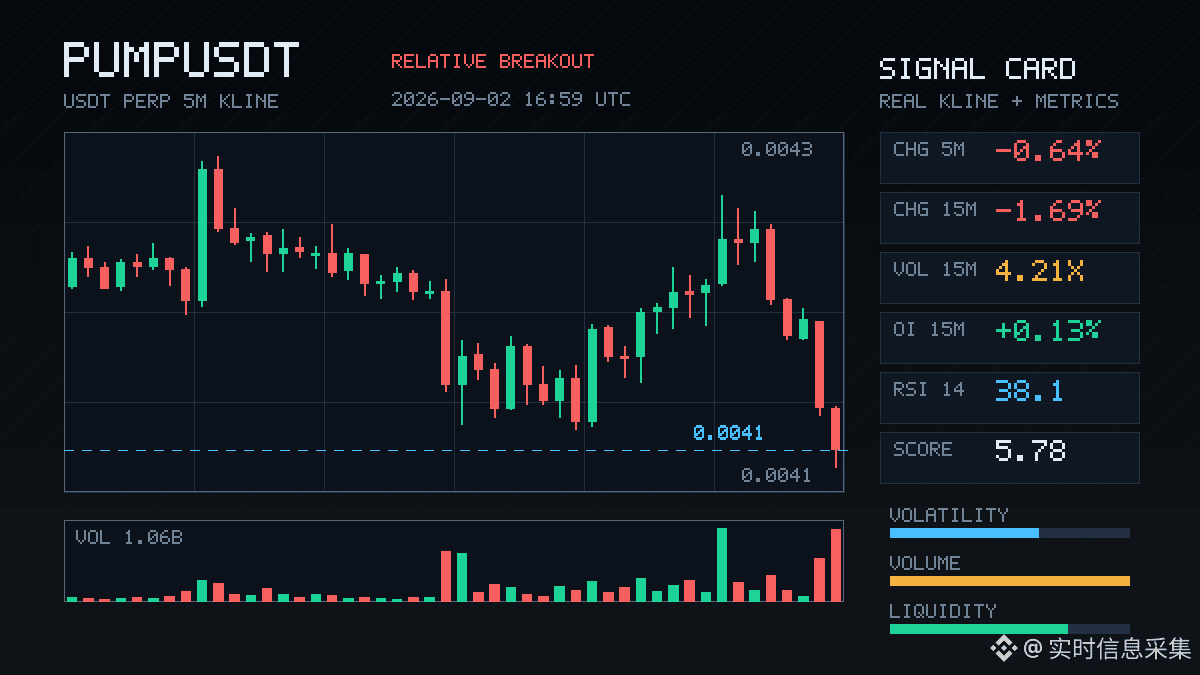
$PUMP 15 minutes-level market dropped another leg downward, directly breaking through the lower bound of the range across nearly 20 consecutive 5-minute K-lines.
The trading volume was more than 4 times the usual, and the volatility Z-value also spiked to 2.47—clearly this isn’t retail traders playing around. This kind of volume-price coordination is more like someone at the high point actively cutting positions or opening shorts to smash the order book. The OI data is also interesting: on the 1-hour timeframe contracts it’s still +1.13%, but the notional change is negative—this is the classic pattern of adding positions while prices fall. The newly added participants are very likely shorts, not bottom-picking funds. Active taker volume is down 5.7%, the buy/sell ratio is 0.89—shorts really are controlling the pace.
What’s even more concerning is the abnormality’s persistence—it's been ranking near the top across several consecutive cycles in the pool. The OI anomaly percentile is 94%, and the notional change ranks 4th in the entire pool. This isn’t something that can be explained by random noise. In the last 24 hours, the trading value was still $166 million, so liquidity isn’t the issue—the question is who is using this liquidity to distribute/offload.
As for the price itself, it has also moved near its historical extreme zone. From here, it’s either a rapid acceleration to make lows, or the beginning of a spiral downward. Don’t rush to catch the falling knife—first, watch when the OI starts to decline again before making a move.
The trading volume was more than 4 times the usual, and the volatility Z-value also spiked to 2.47—clearly this isn’t retail traders playing around. This kind of volume-price coordination is more like someone at the high point actively cutting positions or opening shorts to smash the order book. The OI data is also interesting: on the 1-hour timeframe contracts it’s still +1.13%, but the notional change is negative—this is the classic pattern of adding positions while prices fall. The newly added participants are very likely shorts, not bottom-picking funds. Active taker volume is down 5.7%, the buy/sell ratio is 0.89—shorts really are controlling the pace.
What’s even more concerning is the abnormality’s persistence—it's been ranking near the top across several consecutive cycles in the pool. The OI anomaly percentile is 94%, and the notional change ranks 4th in the entire pool. This isn’t something that can be explained by random noise. In the last 24 hours, the trading value was still $166 million, so liquidity isn’t the issue—the question is who is using this liquidity to distribute/offload.
As for the price itself, it has also moved near its historical extreme zone. From here, it’s either a rapid acceleration to make lows, or the beginning of a spiral downward. Don’t rush to catch the falling knife—first, watch when the OI starts to decline again before making a move.